To view the Title Detail list in the various Edelweiss Analytics graphs, click here in the upper right of any lane:
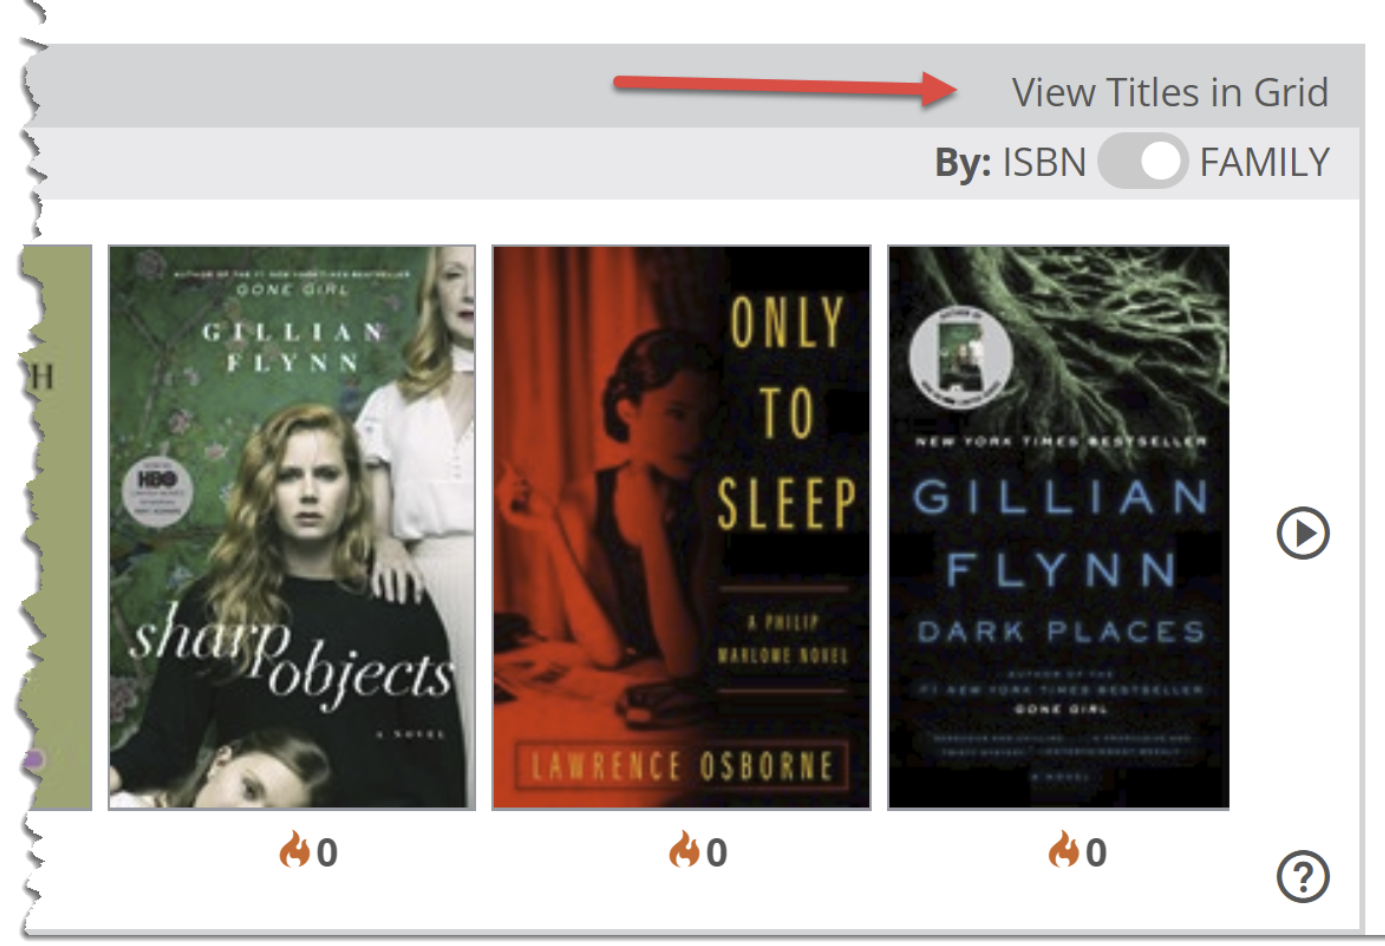
This will expand the section of the pie you’ve selected into a more detailed list, showing market performance details, and additional information about each titles’ performance at your selected account.
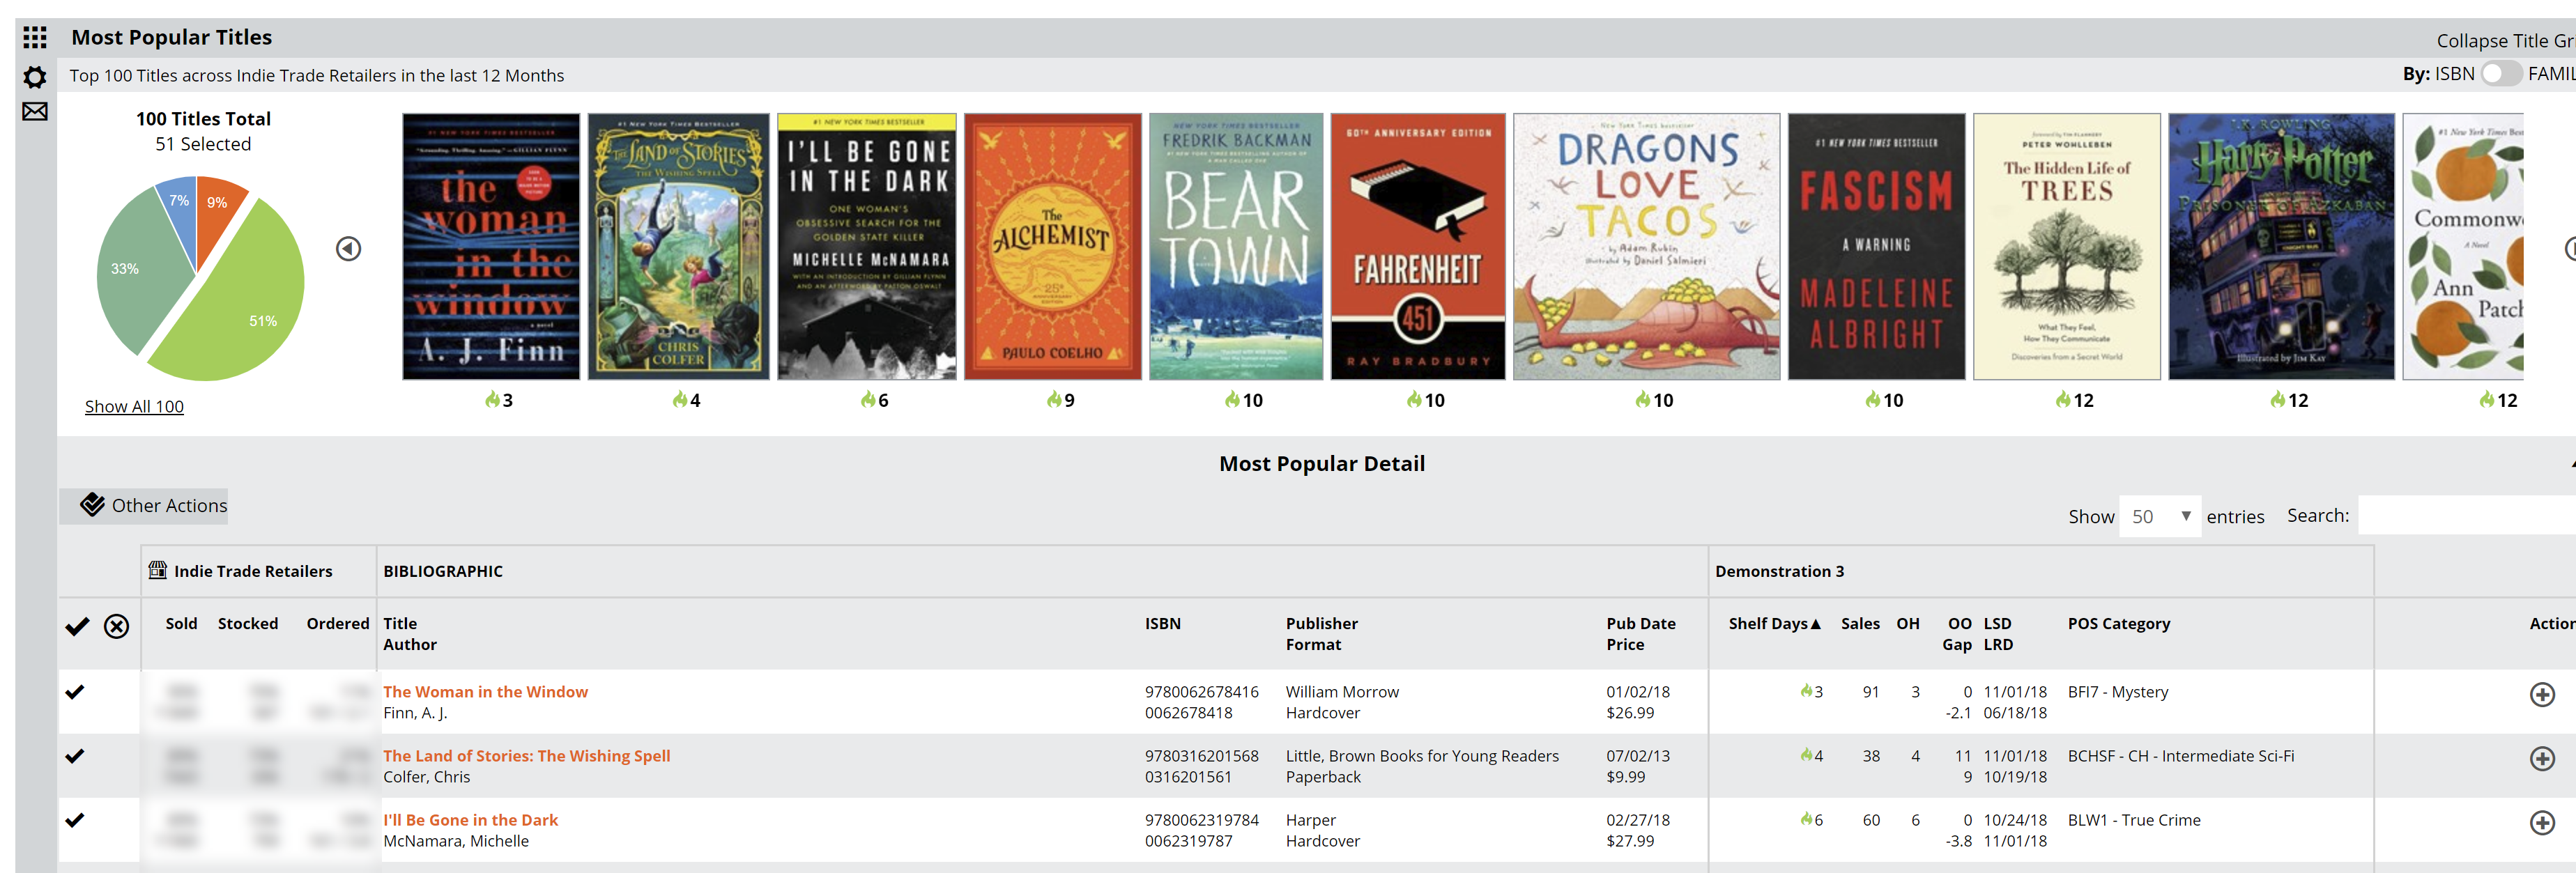
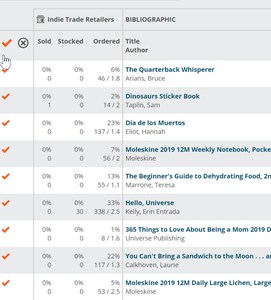
This title grid shows a wealth of information, all sortable and searchable. Here’s a quick tour:
Select the number of titles to view per page.

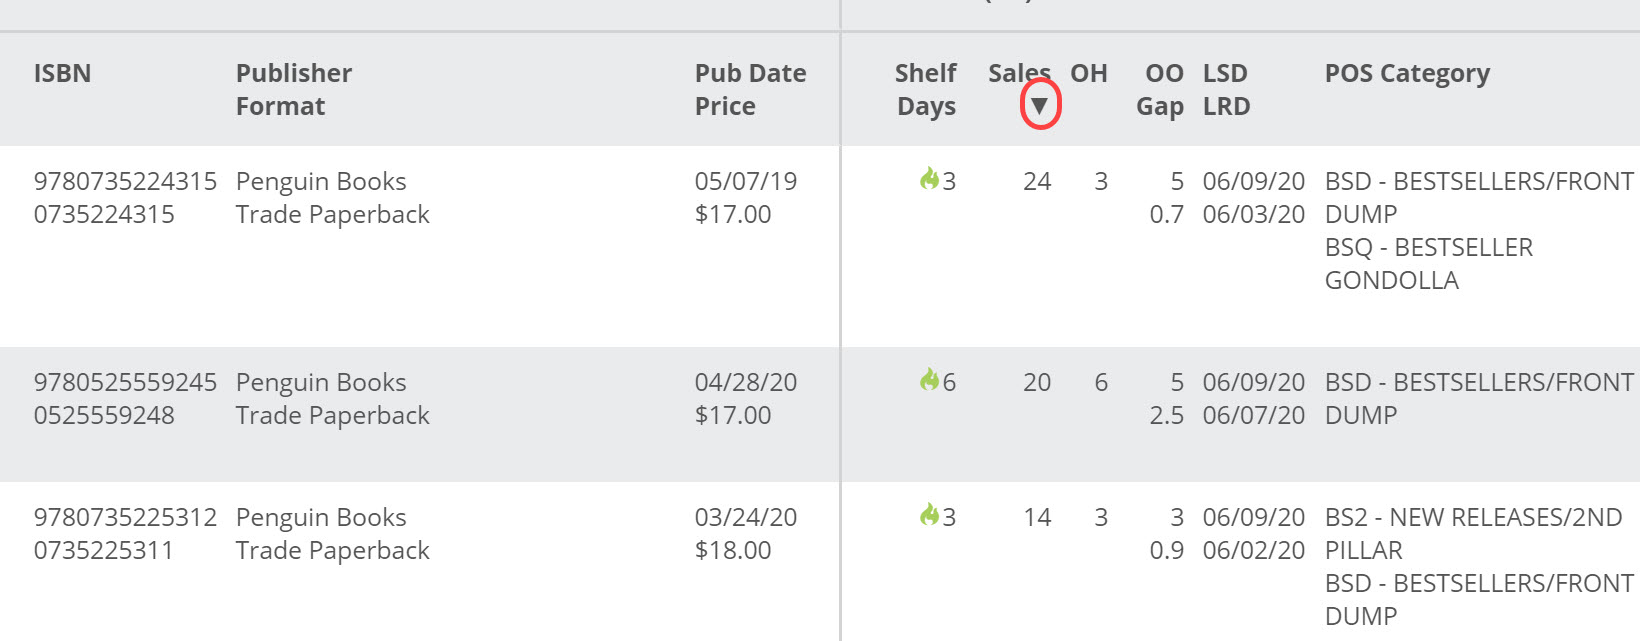
Sort by a specific column by clicking on that column header. Click again to invert that sort. The triangle icon indicates if you’re in ascending or descending sort order.
The checkmarks select titles, and the top one will select or un-select all titles:
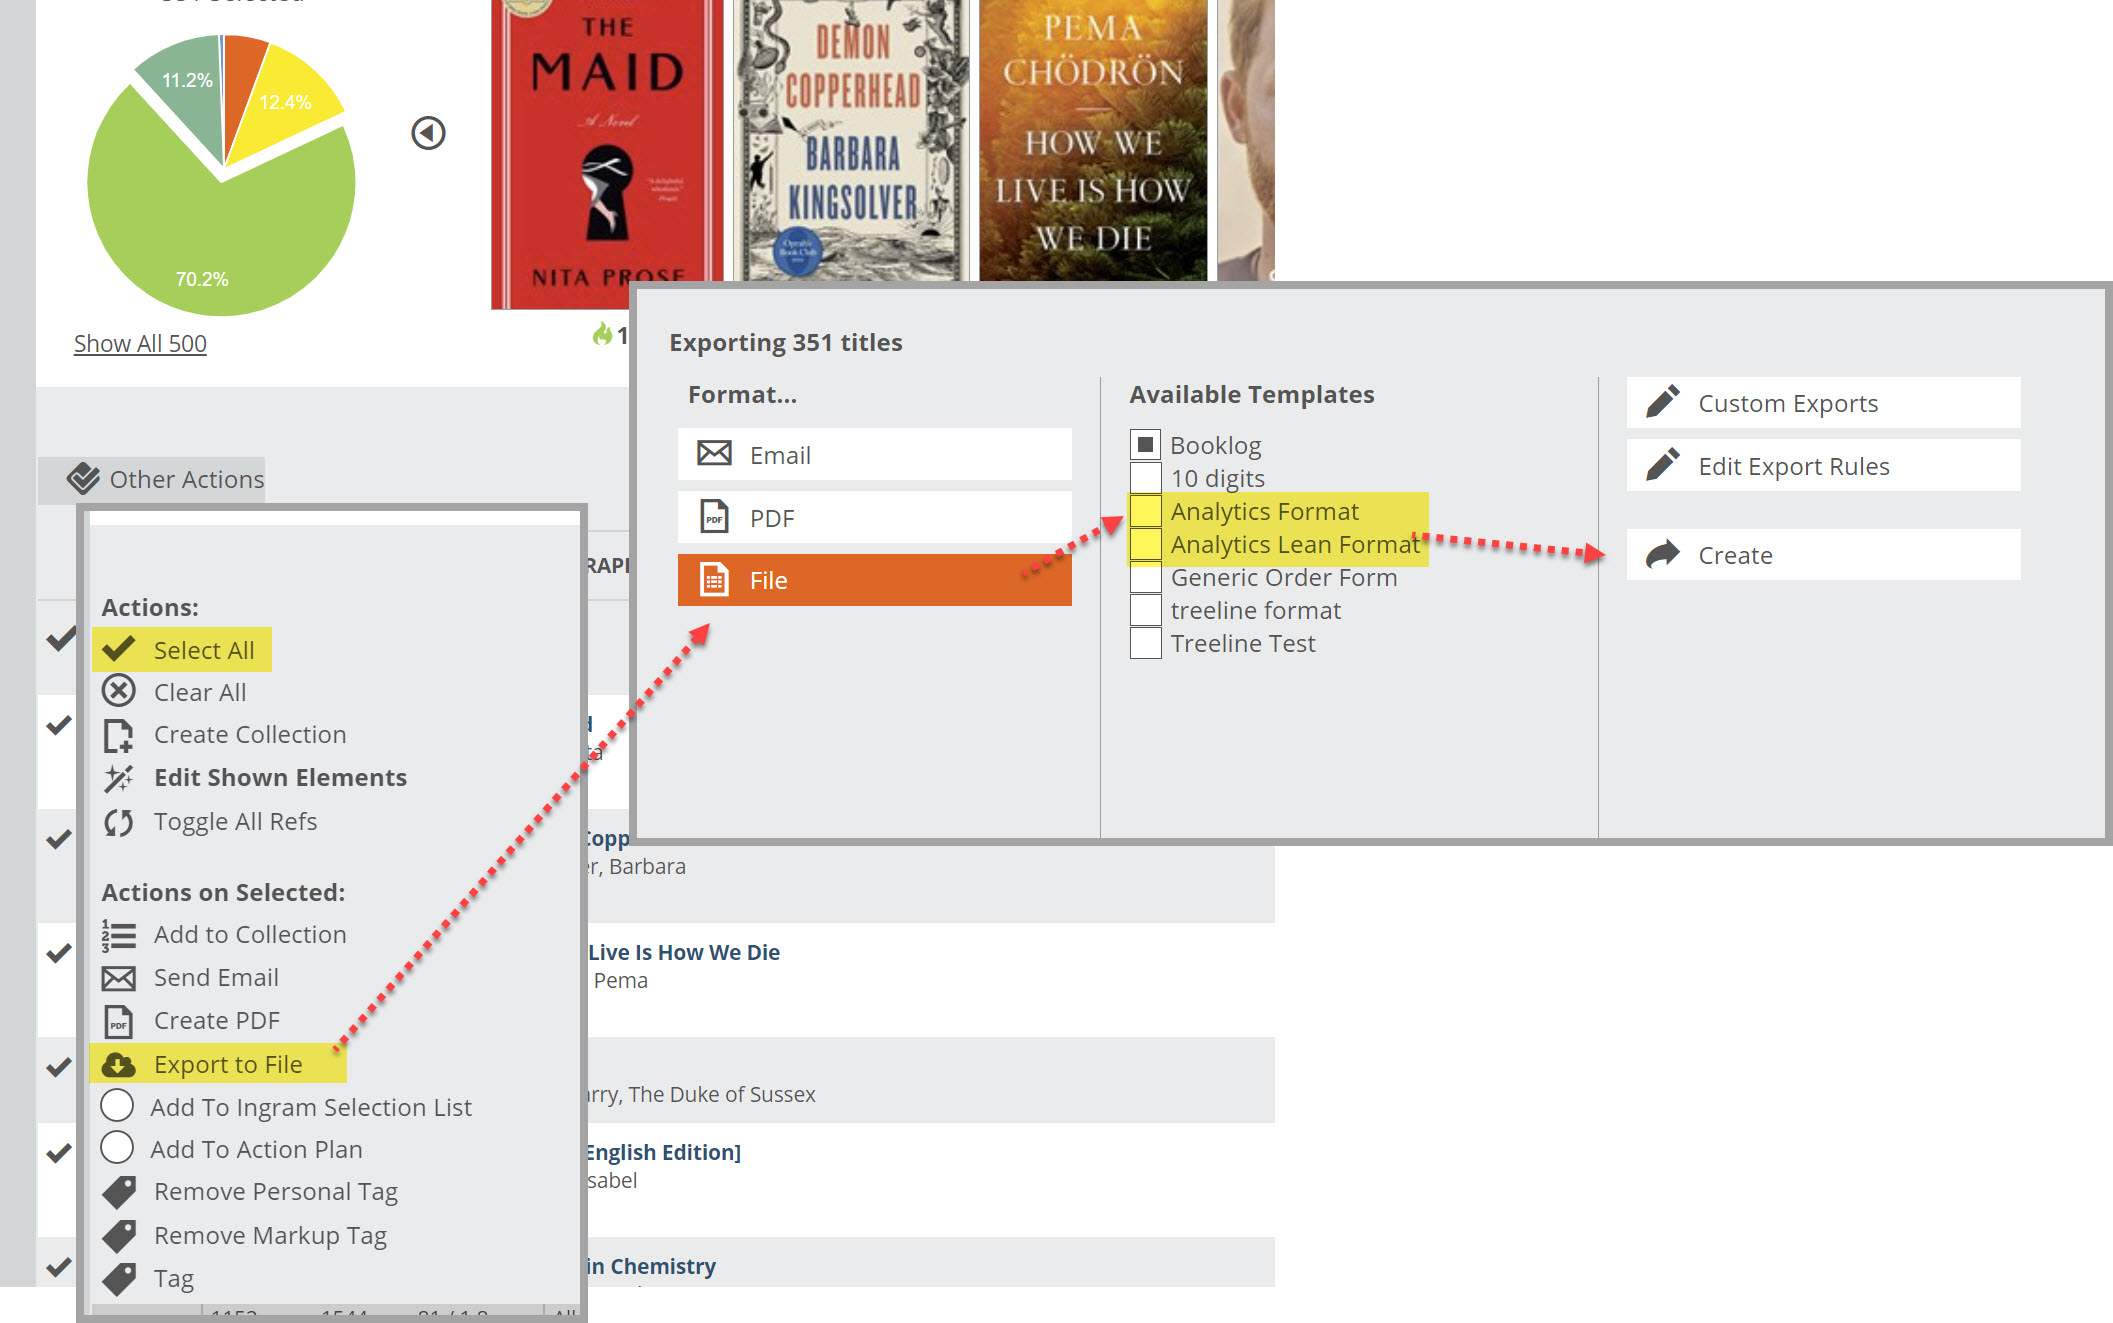
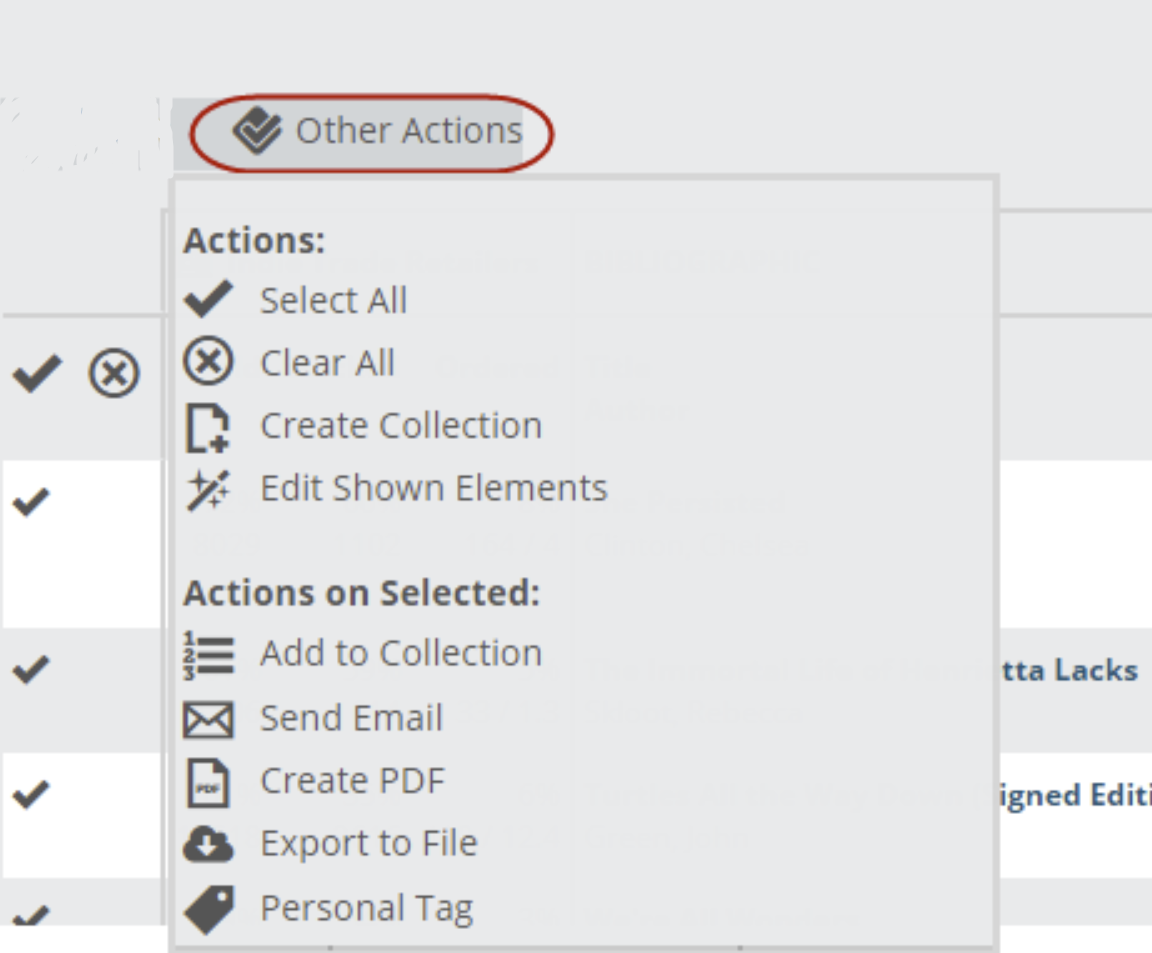
Once selected, you can click in to Other Actions to perform a number of tasks:
In the title grid itself, the first 3 columns represent what is happening with a title in the market, using the time frame you selected to create the graph.

The Sold column shows the percentage of shops that have sold this title in the given time frame. The number underneath is the total number of units sold.
The Stocked column shows the percentage of shops that currently have a tile on hand, with the number underneath representing the total number of units in stock.
The Ordered column shows the percentage of shops that currently have a title on order. The numbers underneath represent the total number of units currently on order on the left and average number of units on each order.
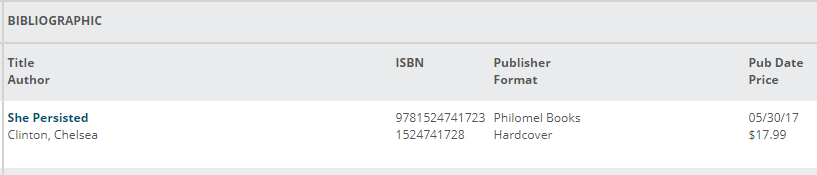
The Bibliographic columns are pretty self-explanatory, showing Title/Author, ISBN, Bibliographic Data, and Pub Date and Price.
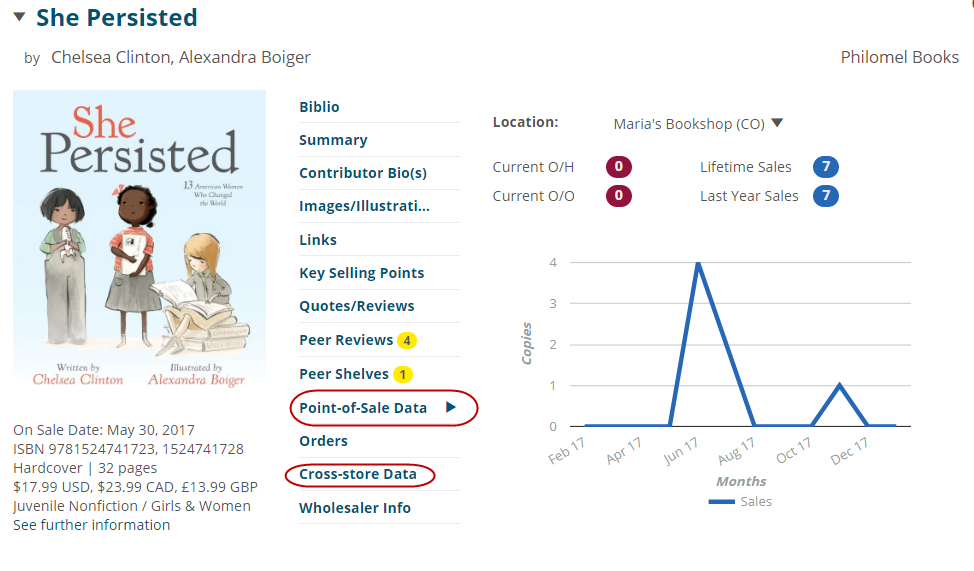
Click on the title to see details, including Point-of-Sale Data, and other information provided by the publisher and any Edelweiss Community activity.
 The Selected Location columns represent the specific data derived from the specific shop you’ve selected. If you have more than one location, you can see each location’s data, or all your shops’ data combined. The selector for this is at the very top of the Analytics page.

Here’s what you’ll see in the Selected Location columns:

Shelf Days indicates the Shelf Days measurement
Sales indicates the number of sales for this title in the specified time frame.
OH indicates the current number of titles currently On Hand at this location.
OO/Gap indicates the average number of units currently on order at this location, and the “Gap from Average,” meaning the gap between their current order and the market average (mostly relevant in the Not Yet Released tool)
LSD/LRD indicates the last sold date on top, and the last received date underneath.
The final column gives you a few tools you can use to differentiate a title in Edelweiss+.

You can add this title to a collection, write and submit a review, add to a shelf, write a note, or add a tag.
Note that you can search for a title within any title detail list, as well. As you type, the list below will indicate any title that contains that text:

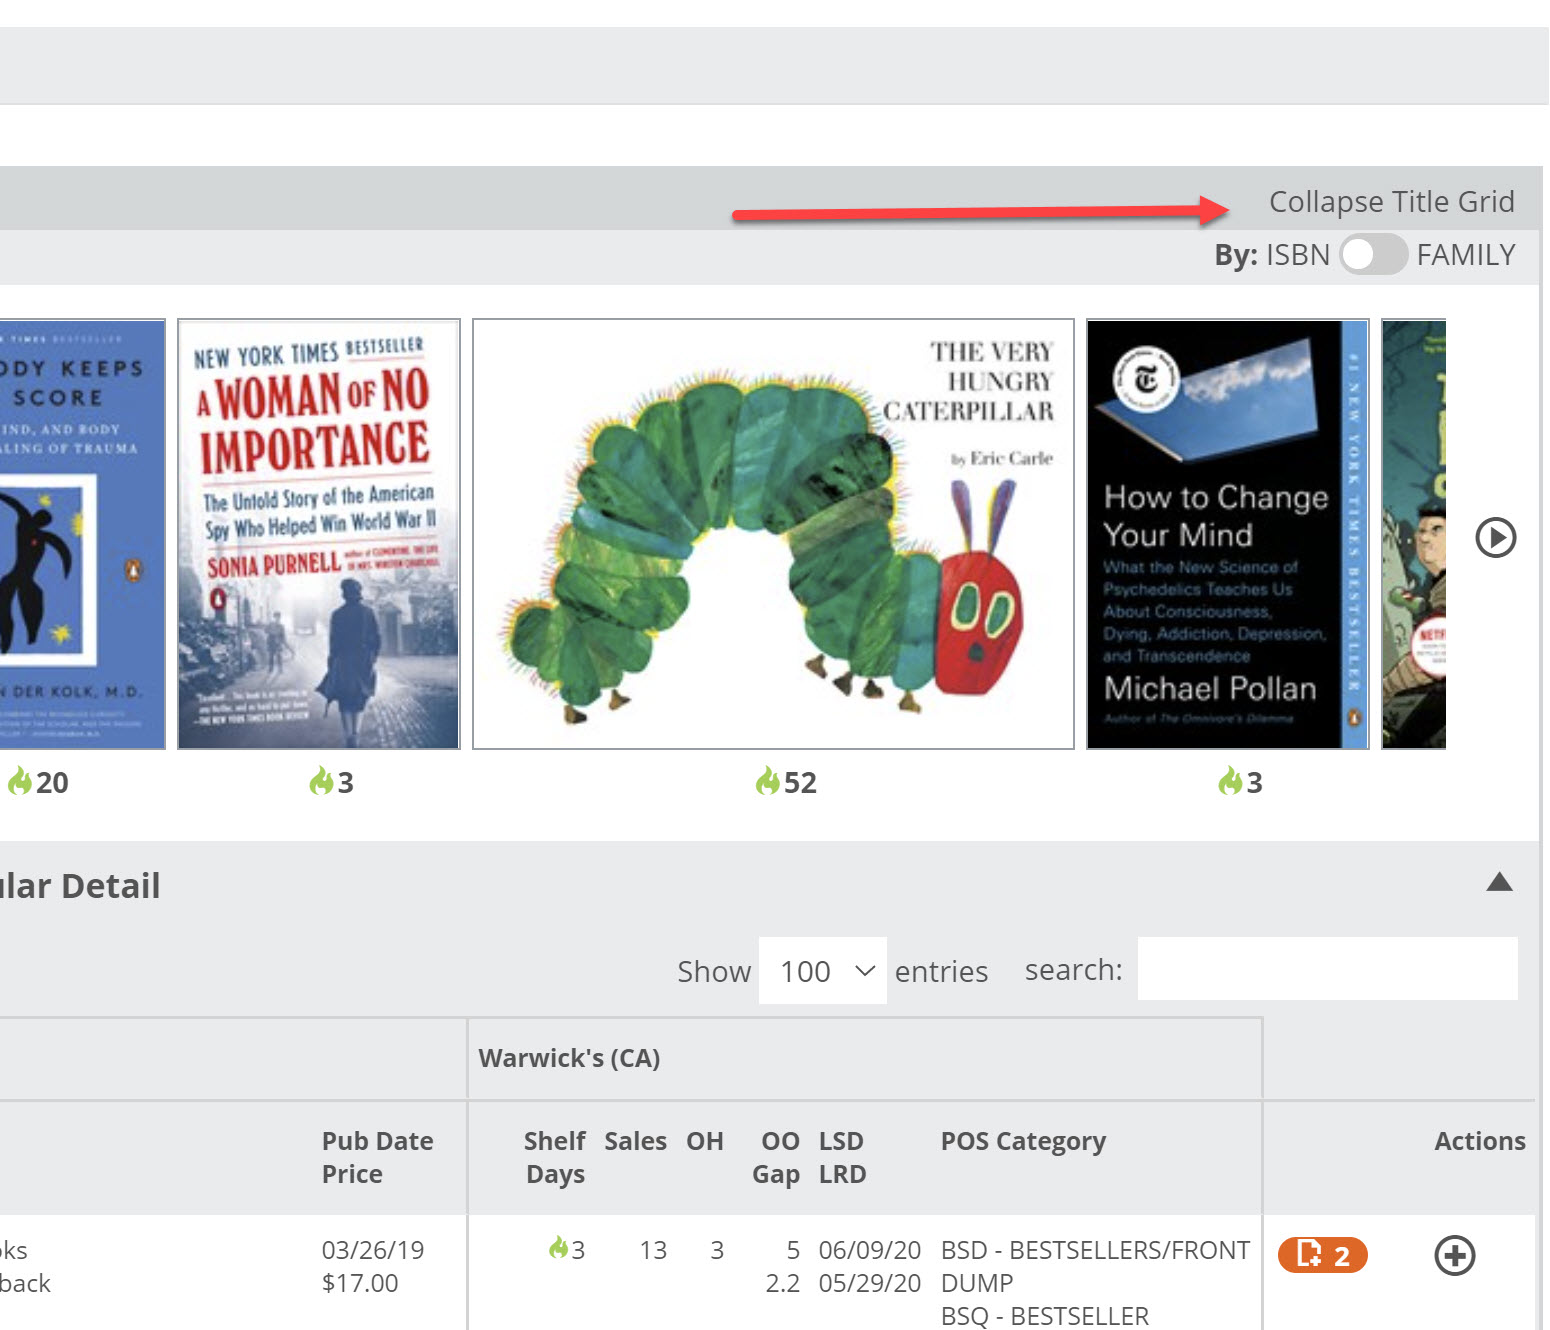
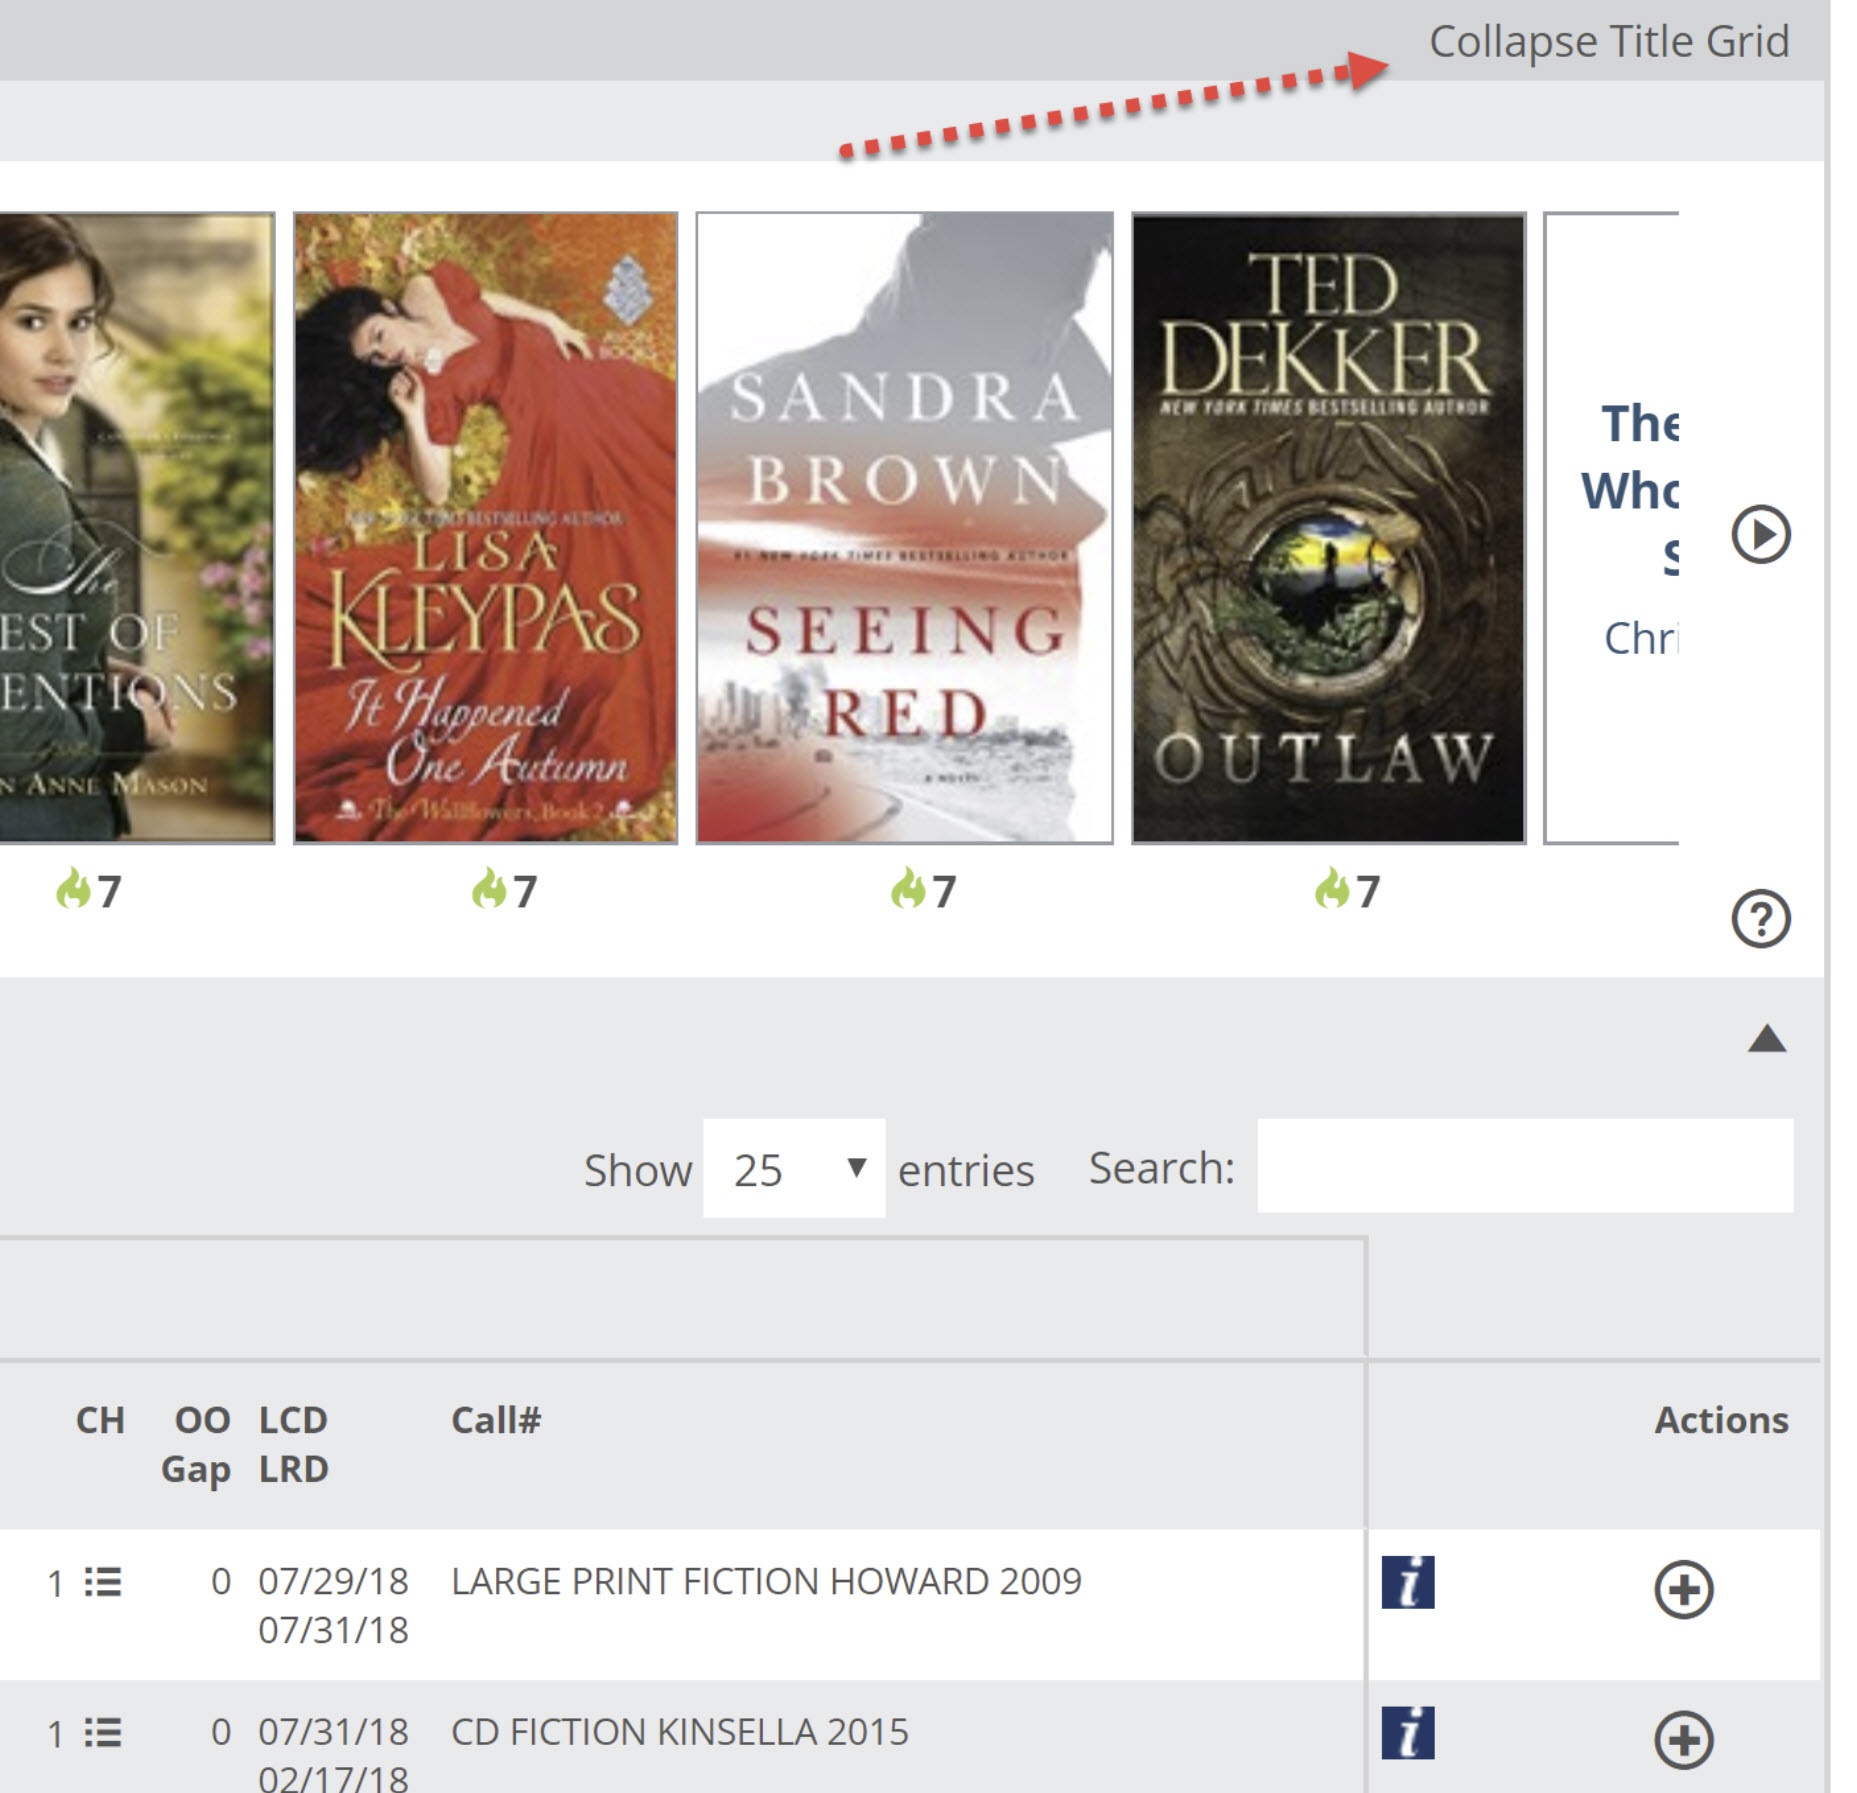
Collapse Title Grid will close the Title Detail List and show your various other Analytics lanes again:
You can easily send your title list to an Excel document where you can sort and copy and paste and print as needed. The Analytics Format will export the list and include all piece of information seen in the Title Detail List.