
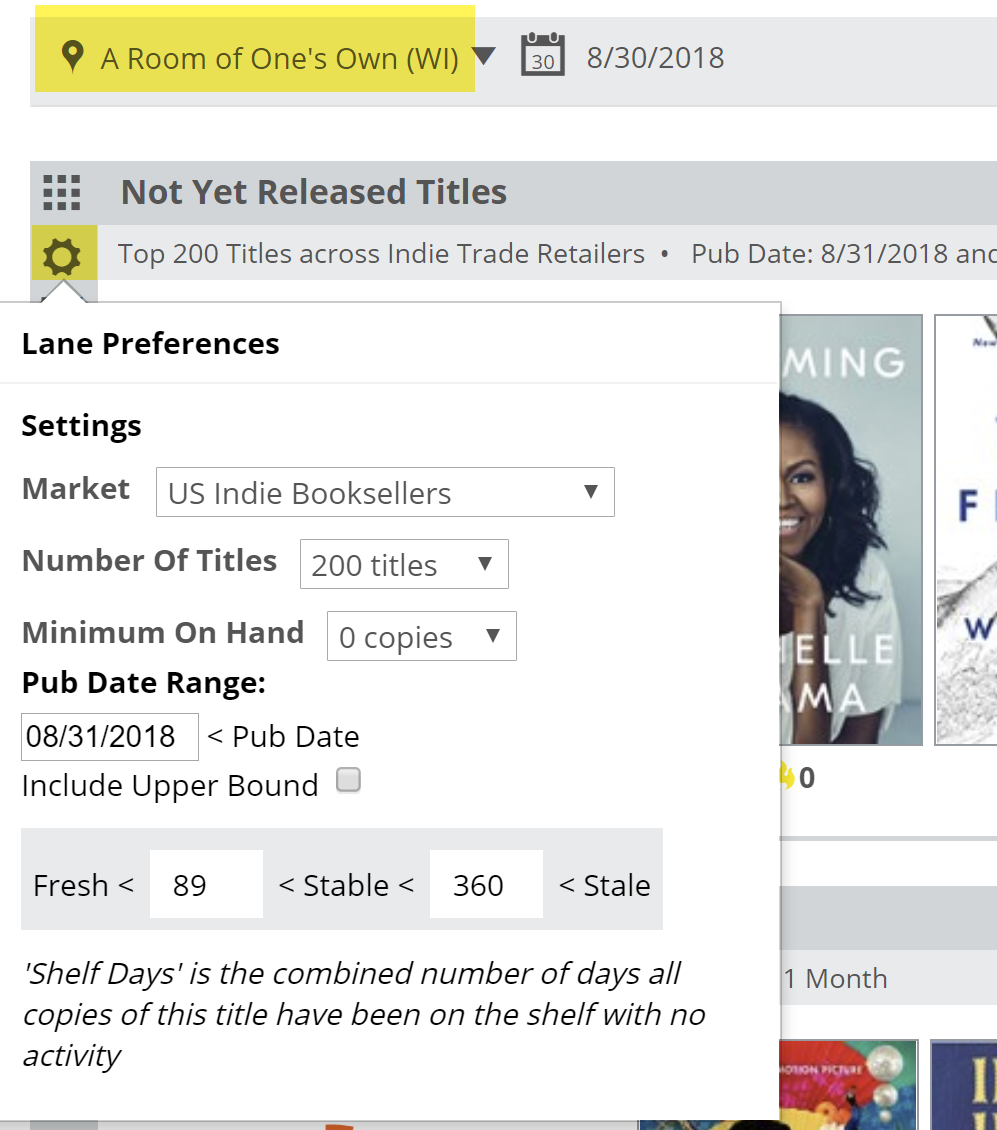
Click the gear icon on the left of the lane to reveal a menu in which you can set a few parameters for this graph.
Be sure to select an account at the top of the page, as well.
Here’s an explanation for each of your options:
Market:
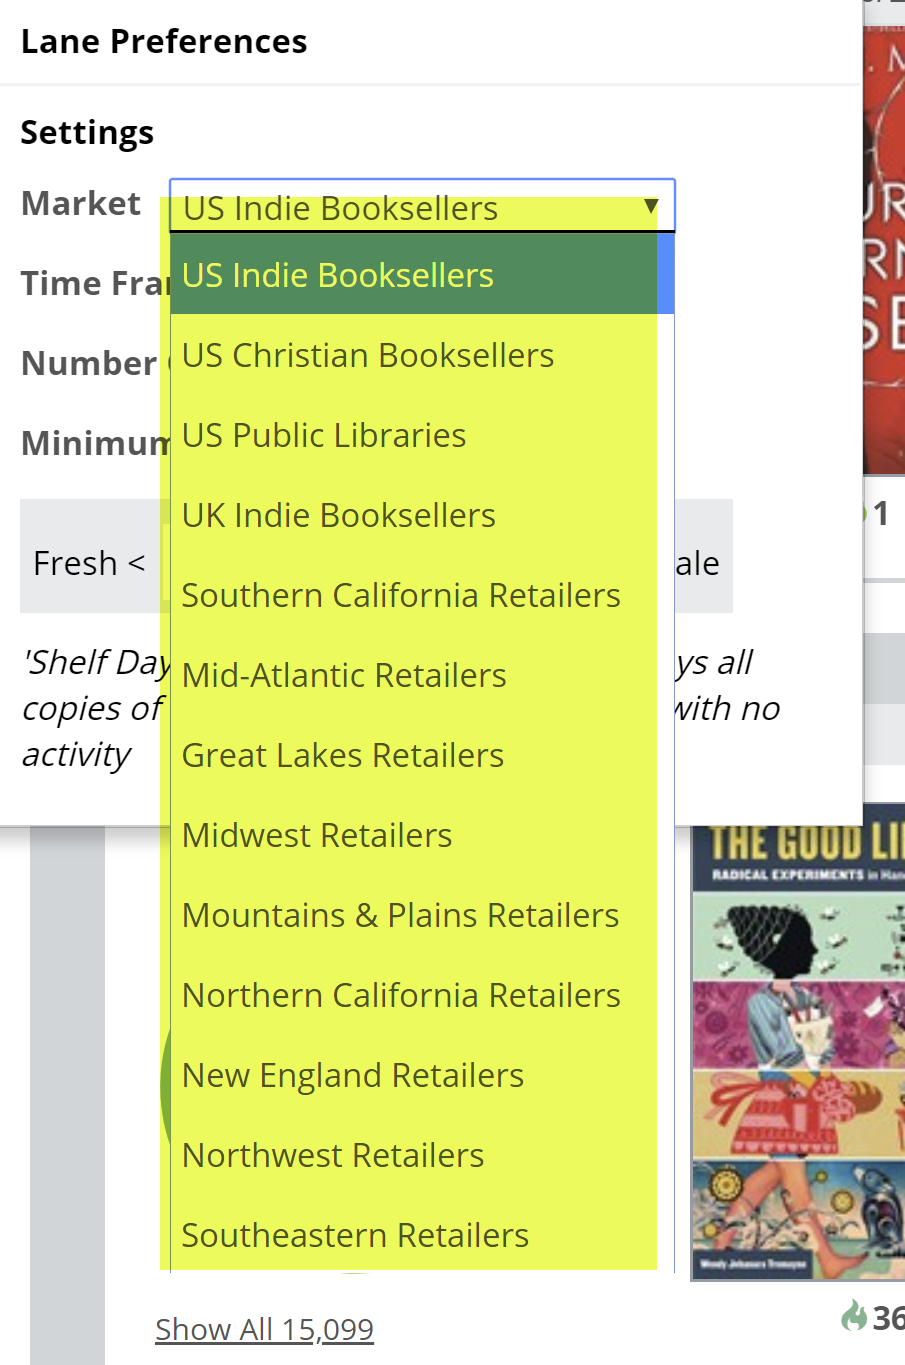
You can select to view results for a number of market options. So, this graph will show the aggregated on-order data that shows in the POS feeds from each organization in that selected market.
Number of Titles:
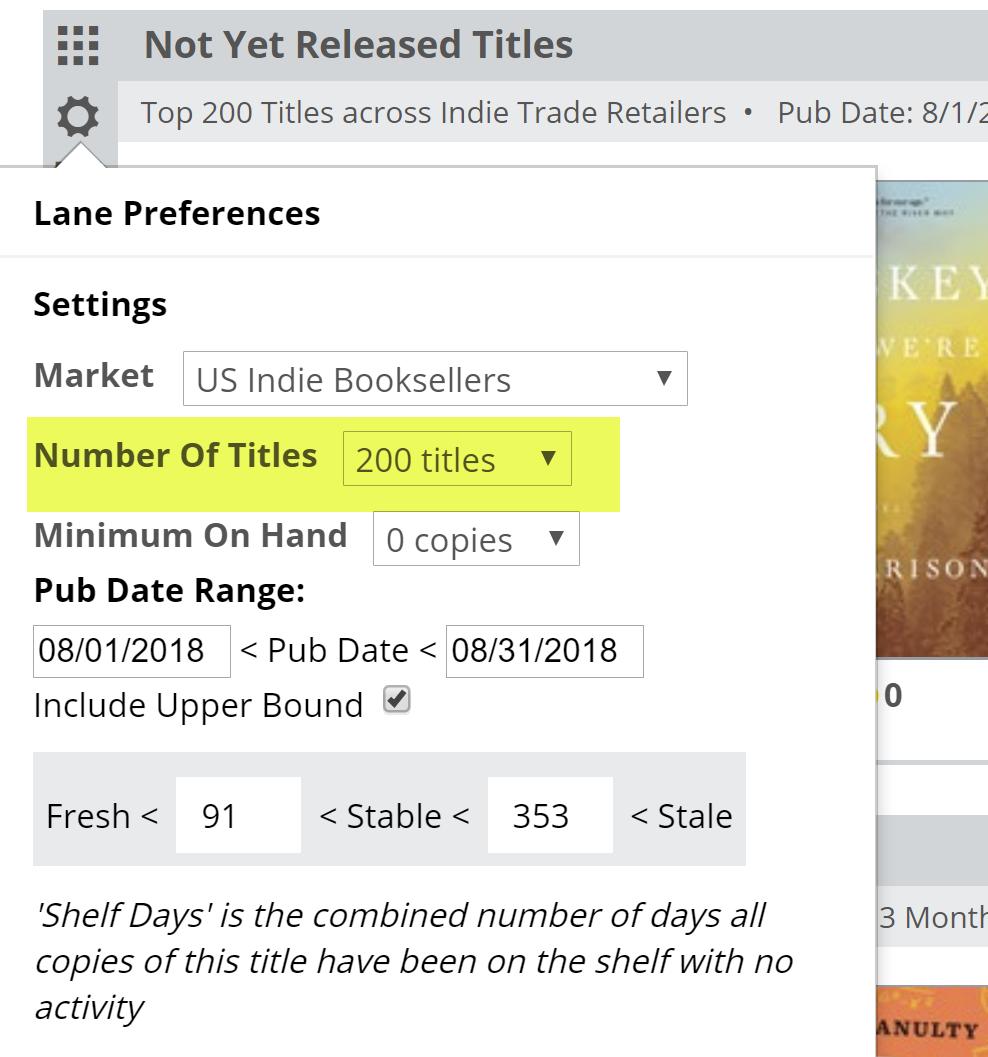 How much time do you have? What sort of project are you working on? How big is the account you’re viewing? A quick look at the 100 most-ordered titles in a given category (see about applying filters here) can be a nice and quick view of your biggest upcoming titles.
With that in mind, for a particular account, you can view your top 100 upcoming titles and really just zero in on a few that are not currently on order, whether their buyer missed or skipped those titles.
Minimum On Hand:
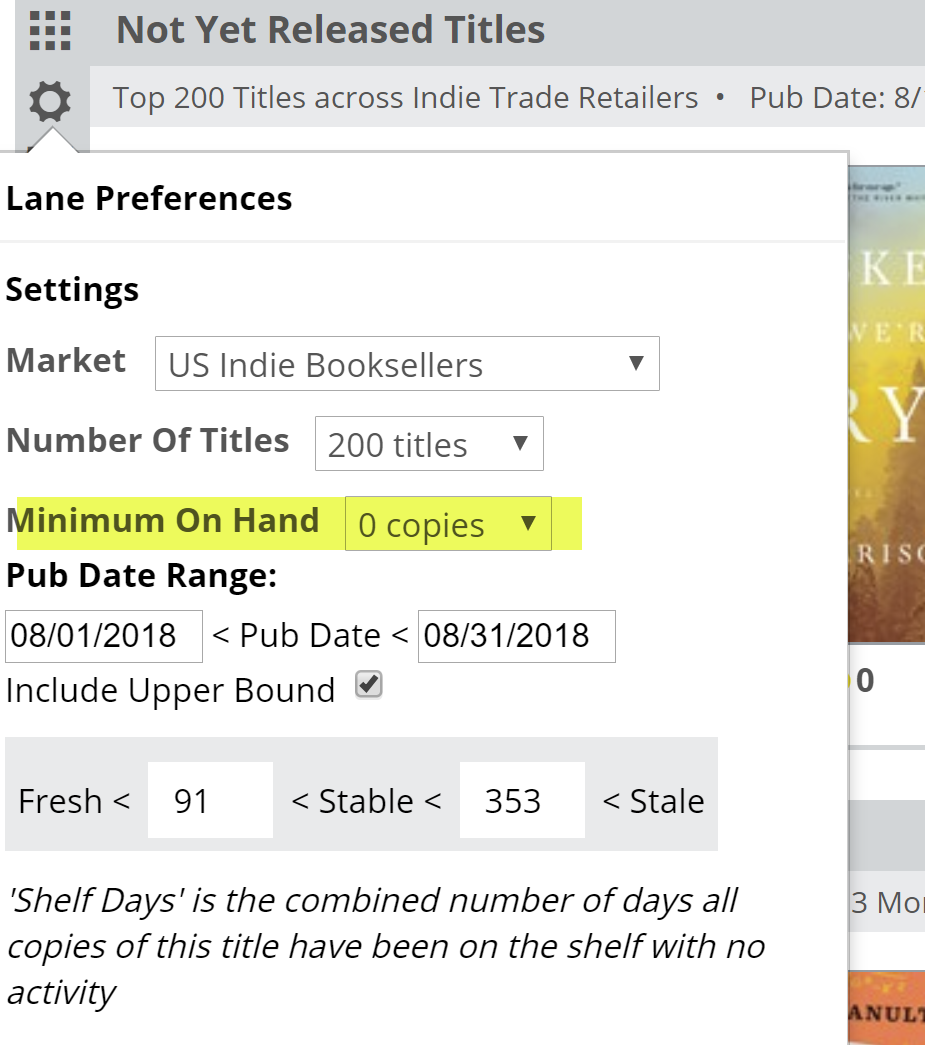
You’ll want this set to “0” for this graph, since these are, by definition, titles that are not currently in stock.
Pub Date Range:
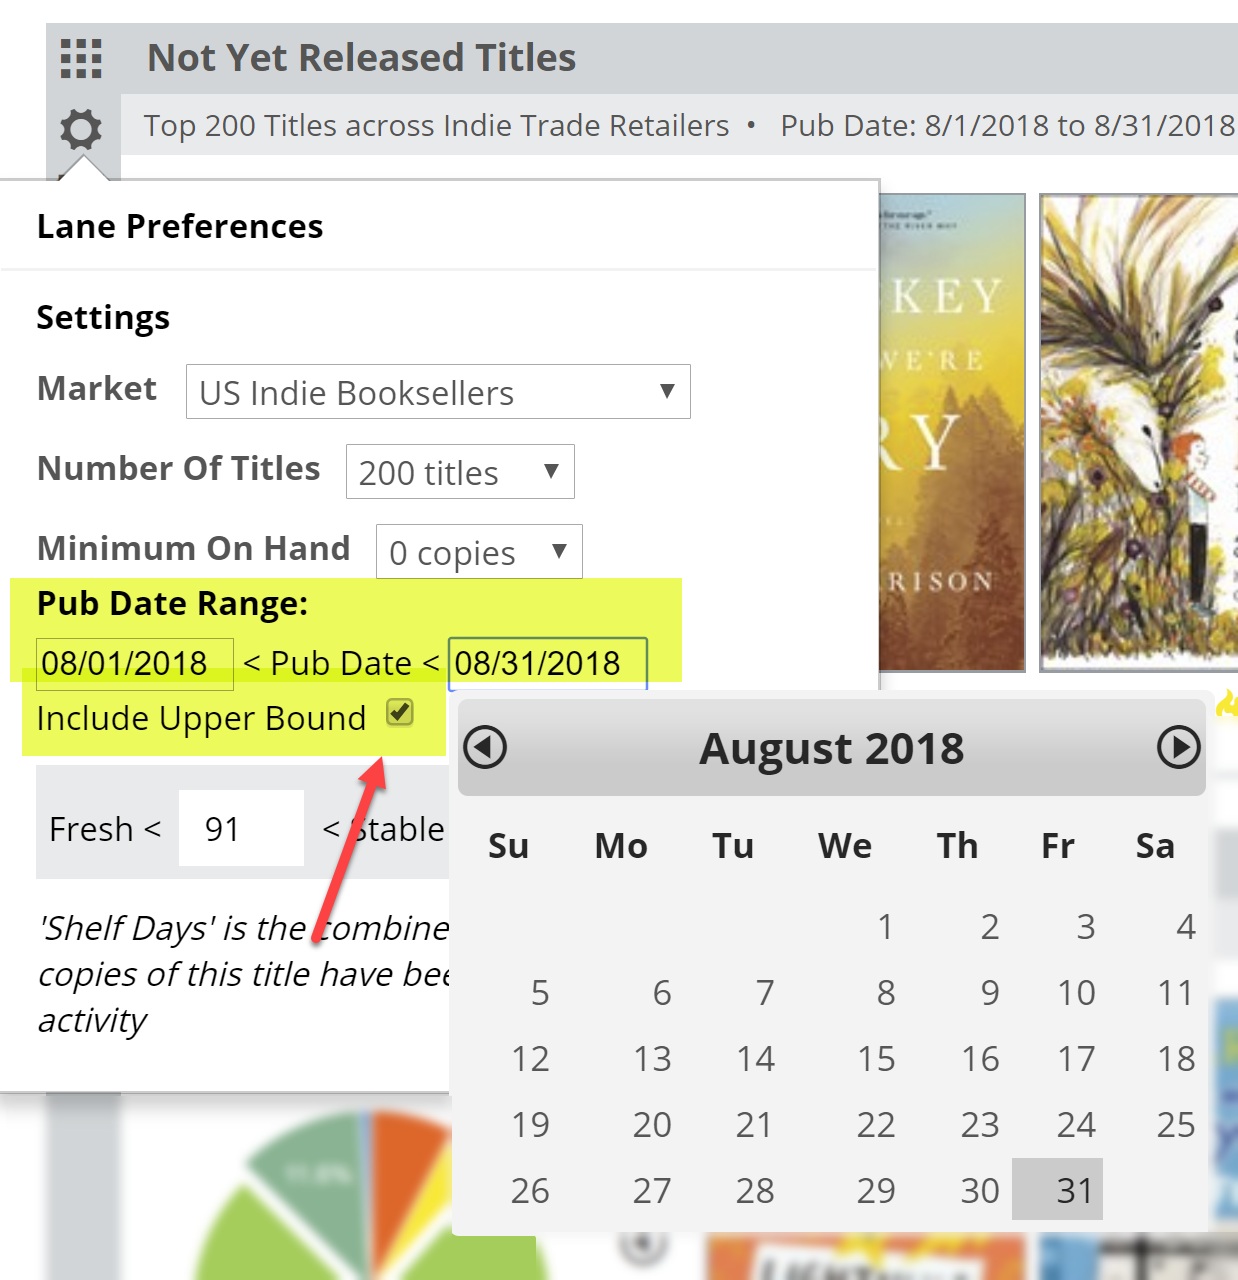
The most common use for this graph, and a best practice, would be to look, mid-month or so, at the most-ordered titles coming out next month to help you catch those bigger titles that your account may have missed. You can set that range of publication dates here. You can, if you like, extend this out a full season, even, to see which titles are the most popular among your accounts for the upcoming holiday season, for example. Looking at a larger range, you may want to increase the number of titles you’re viewing.
Shelf Days:
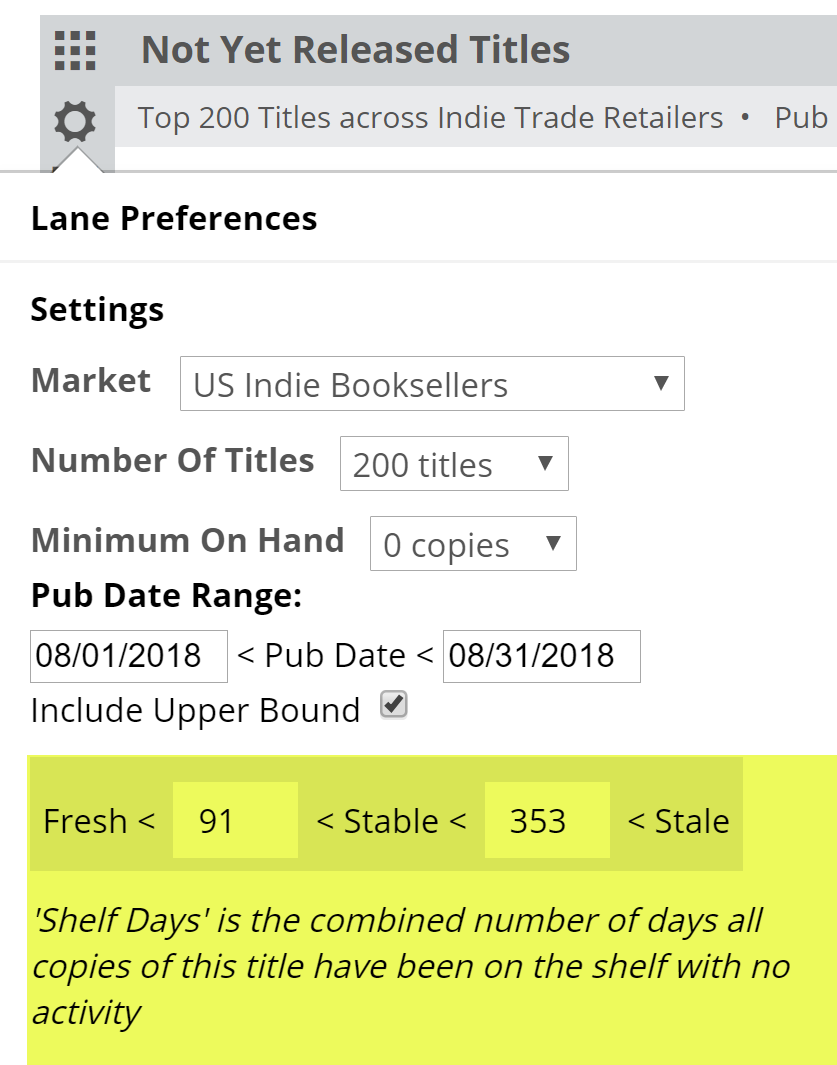
Shelf Days are fully explained here. This essentially allows you to set an upper and lower performance measure on your accounts’ inventory. These numbers are not as relevant in this graph as in the rest of the Analytics tools, since they lack sales activity.