
One of the most common questions publisher folks want answered with the Analytics tools is simply, “How is that one title doing?” Following is a little ditty about how to quickly find that information.
Search and Cross-Store View
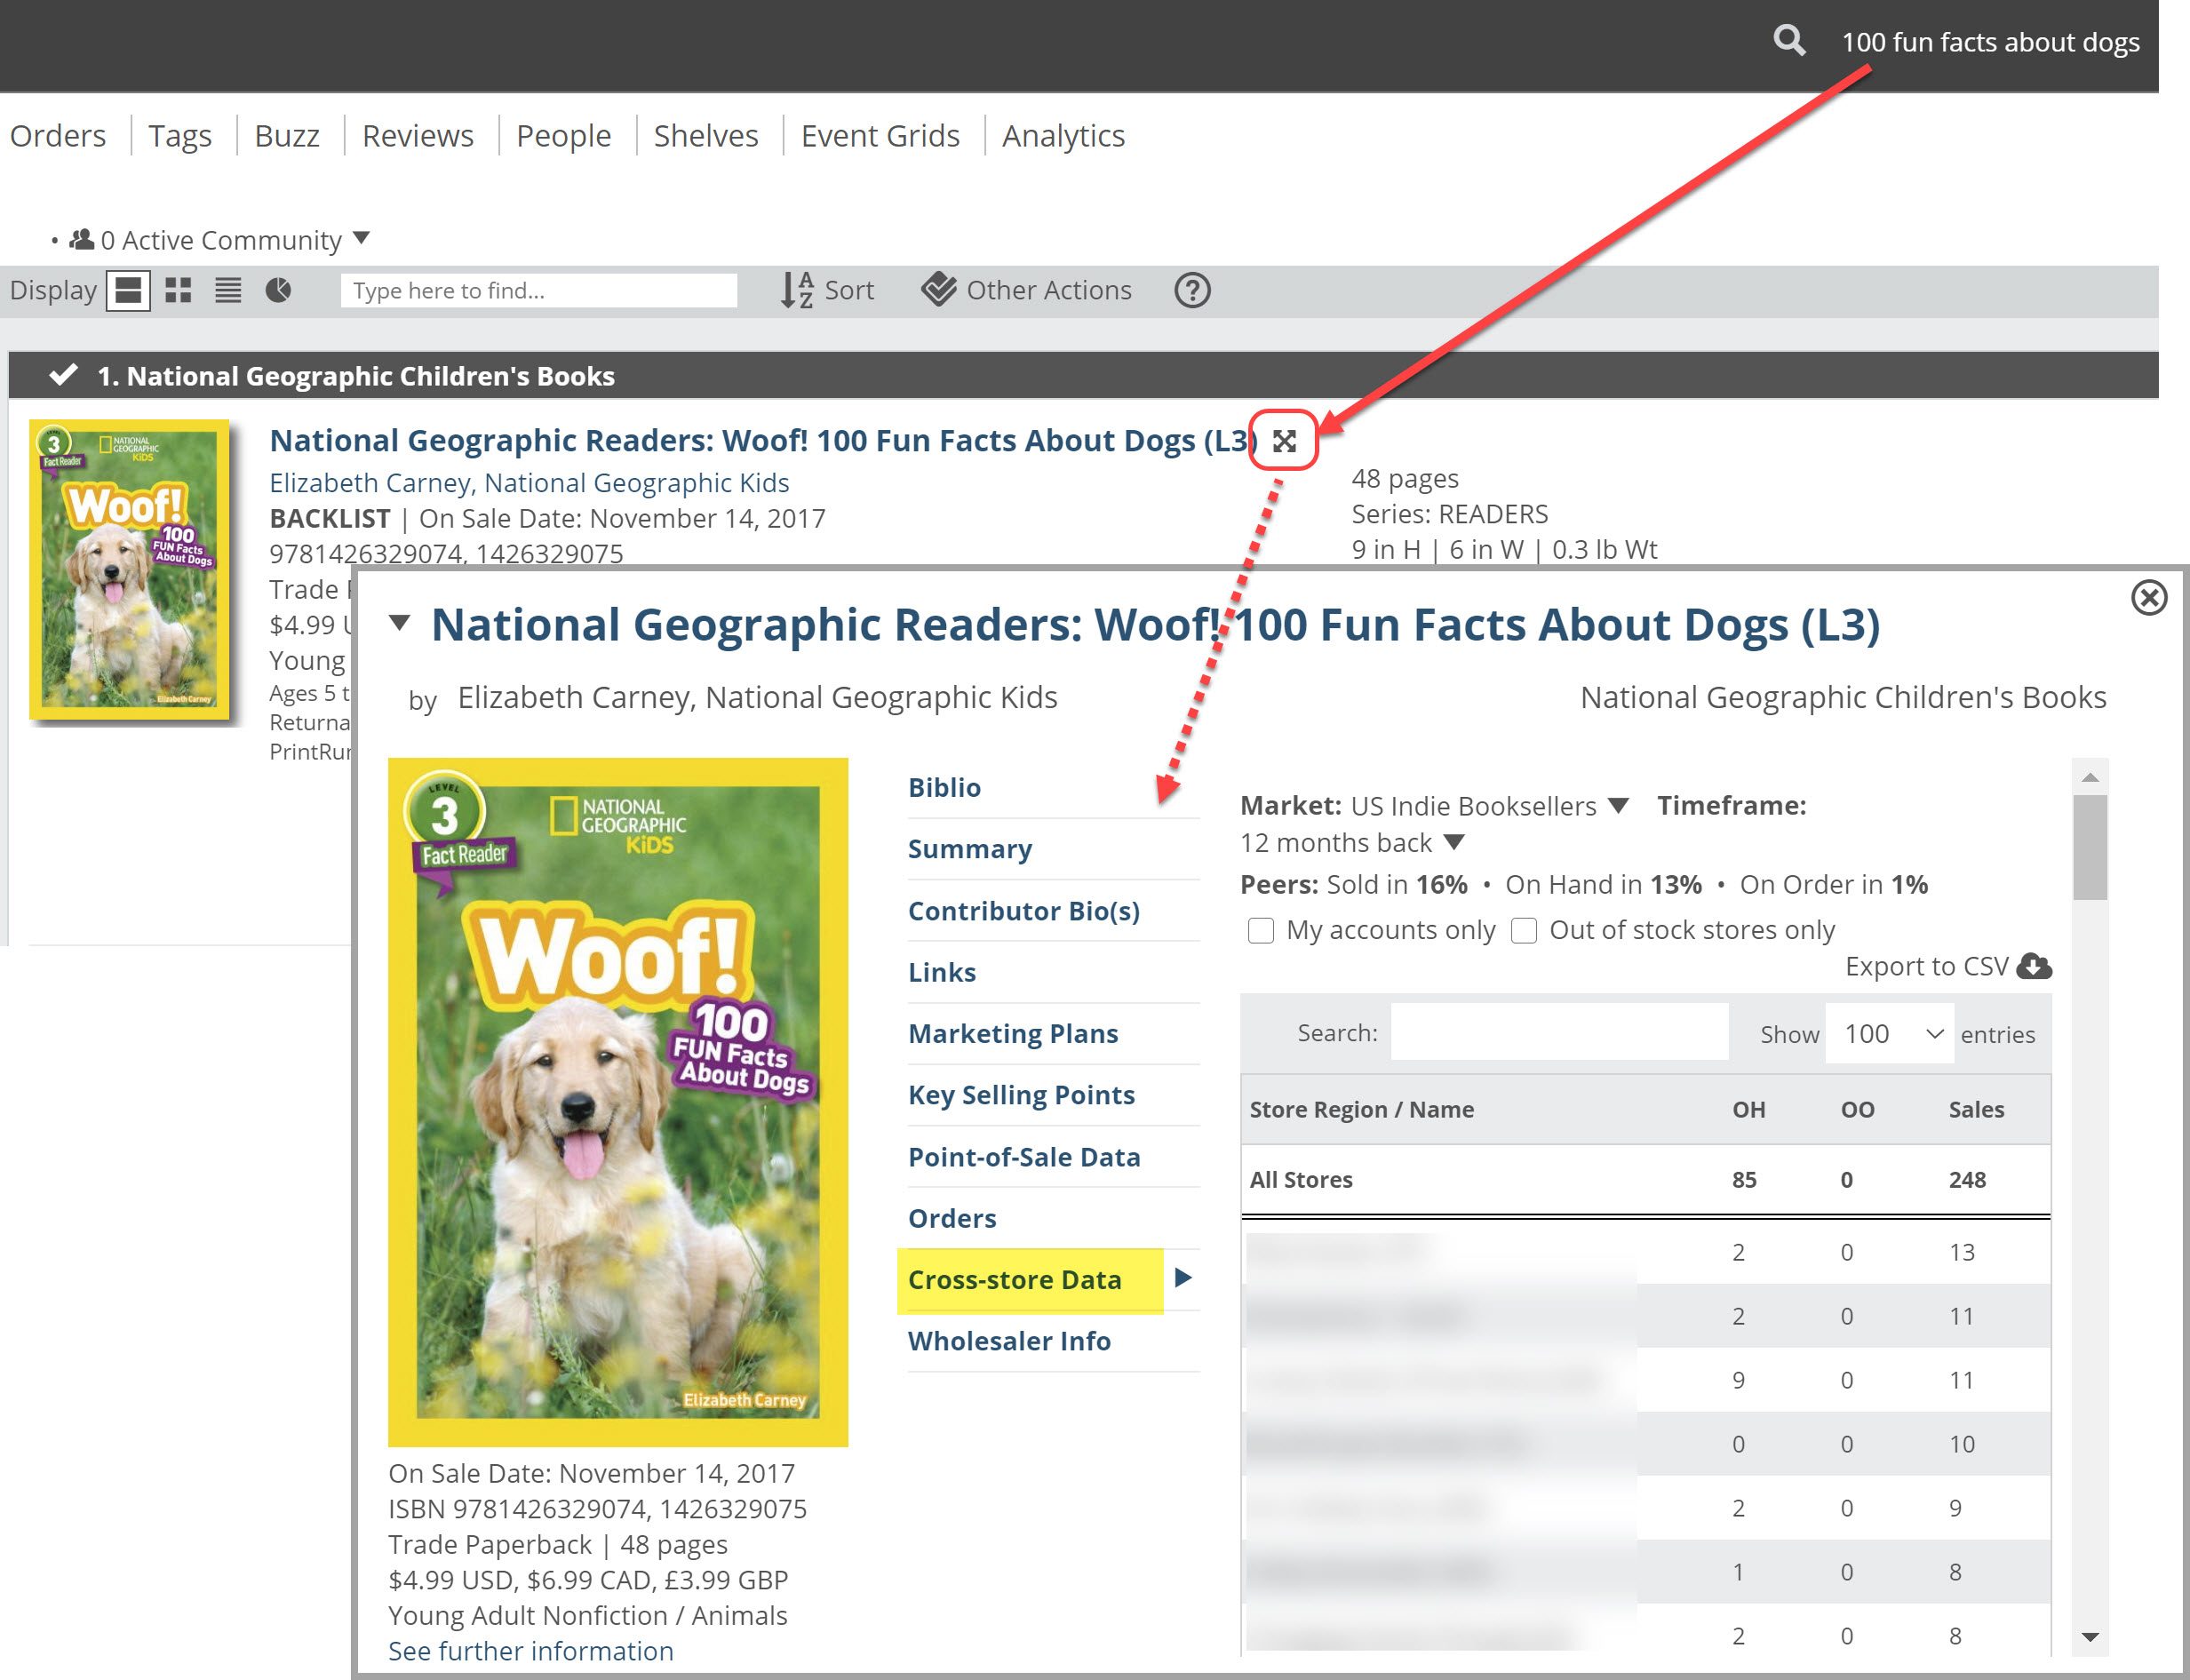
A simple Edelweiss title search will get you to a specific title. Here’s a bit about the finer points of searching in Edelweiss. When you’ve found that title, click the “Expand icon next to the title itself will pull up a new screen with a ton of info. Click in to Cross-store Data to see data on how a title is performing around the market, at specific stores.
Analytics Display View
You can very quickly get an easy Stock Analysis-type view of any title list in Edelweiss, whether it’s an order, filtered search, list of Buzz titles, Tags, a Collection, etc.
Getting there is as simple as clicking this Analytics Display icon at the top of any title list:
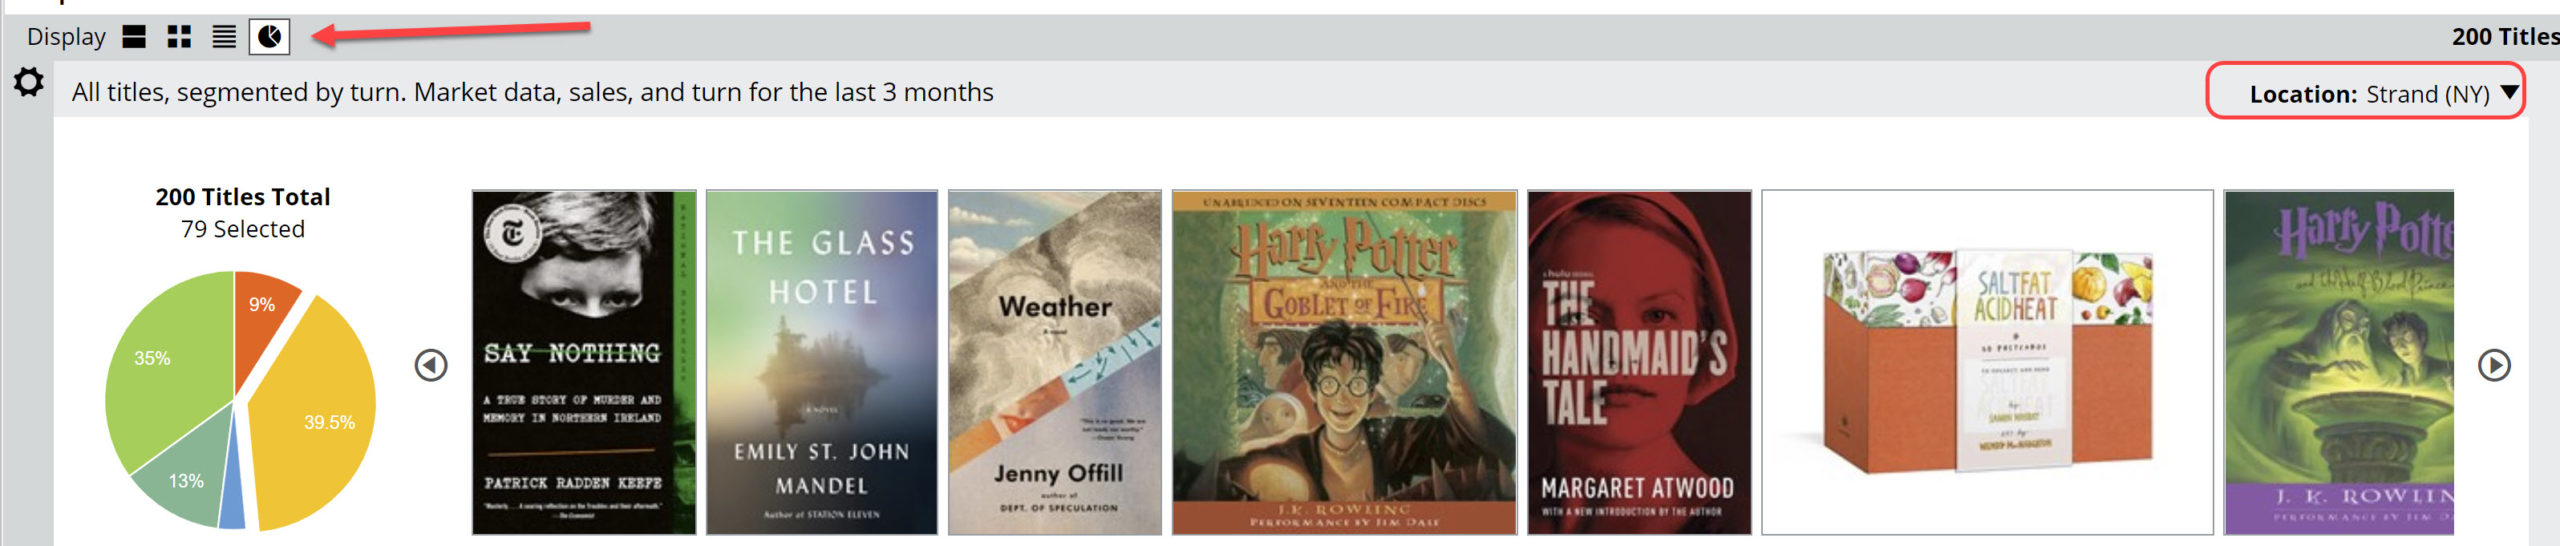
Choose a location/store to analyze at the top right.
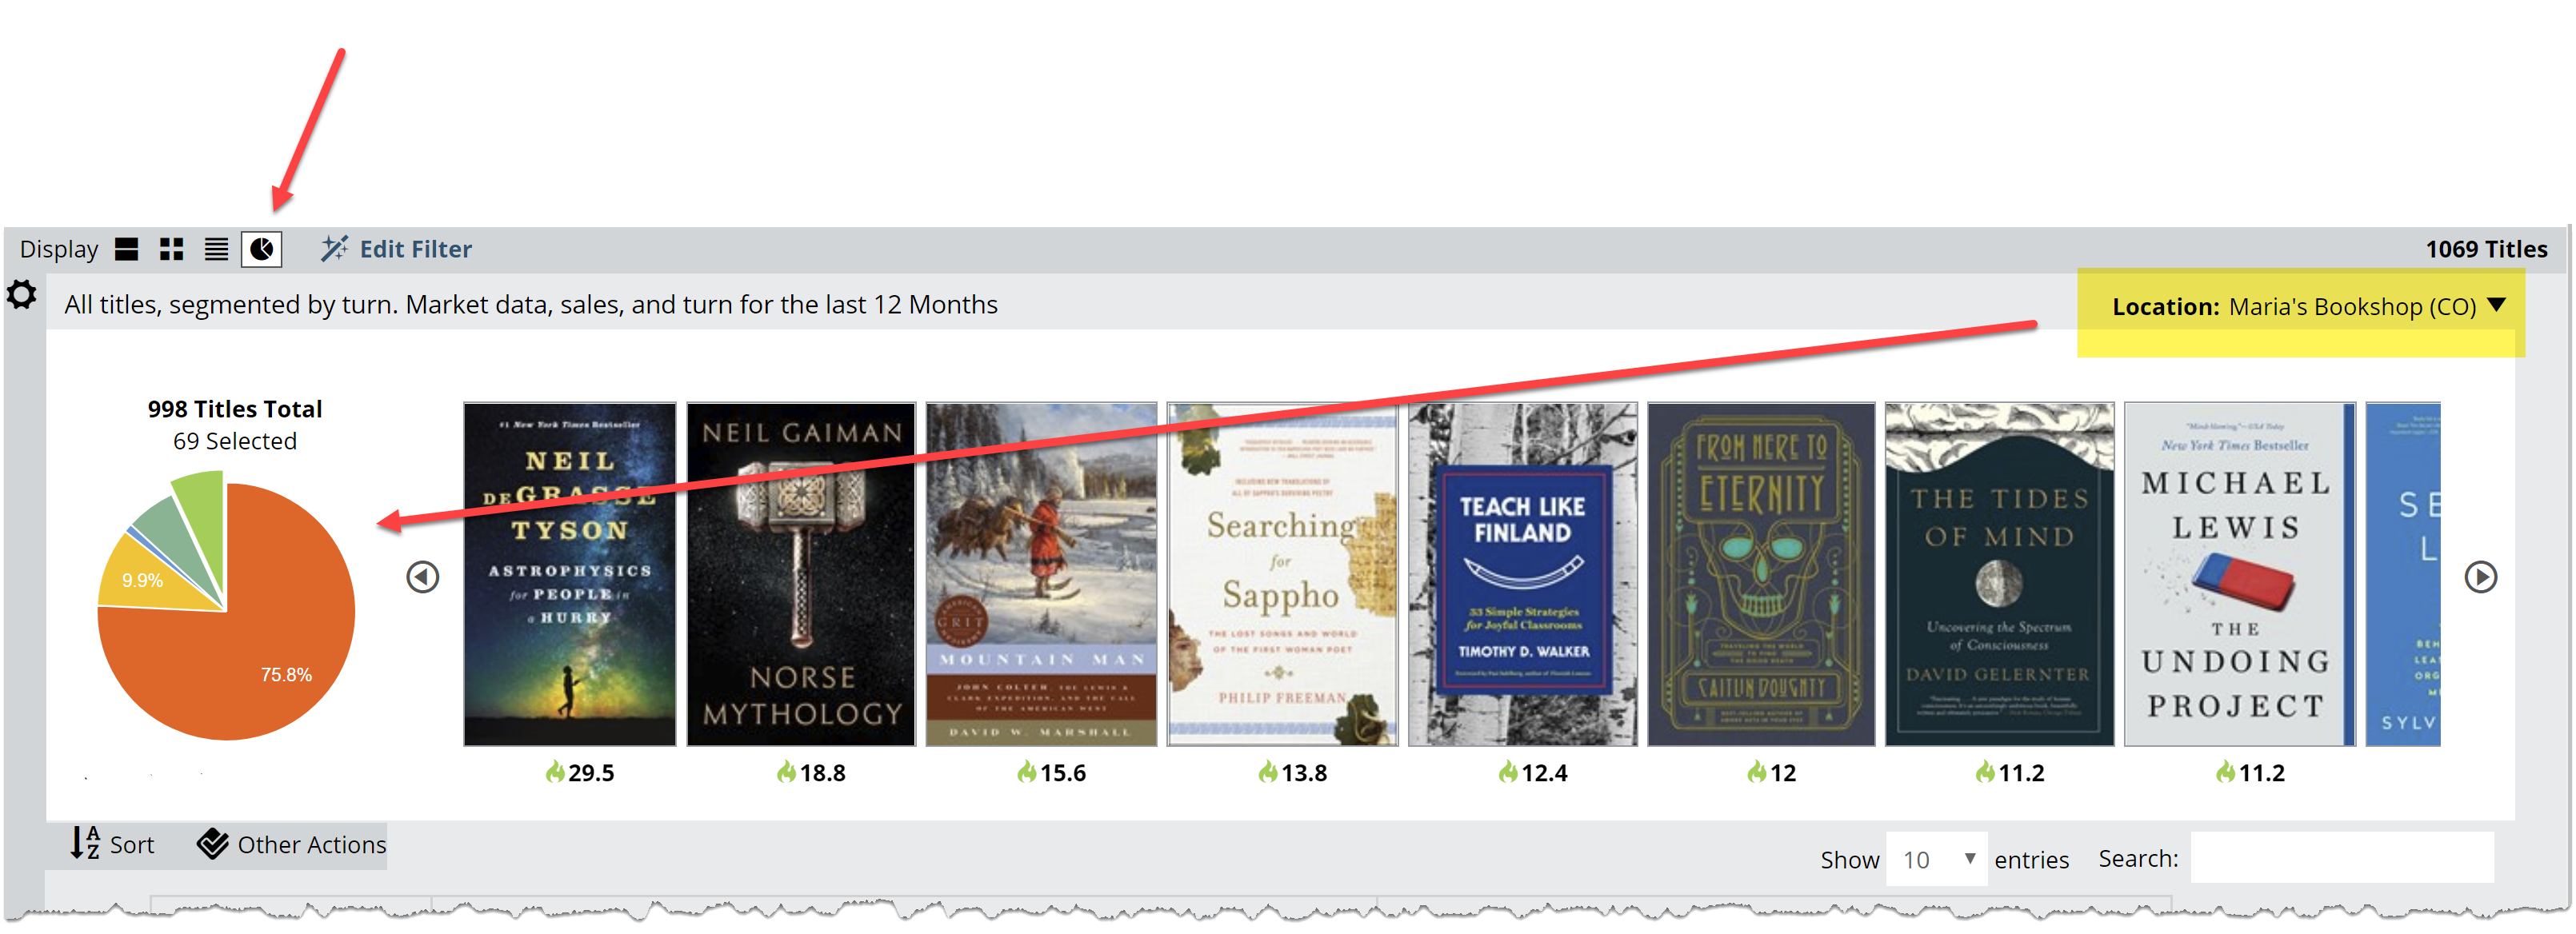
The full pie graph will represent all the titles in the current list of titles. That list will be broken down according to either the usual Shelf Days parameters, or according to Turns, as well as the store’s current stock and performance status. This means that for any given list of titles, you can see how they’re performing for a particular account, or whether they even have them in stock or on order.
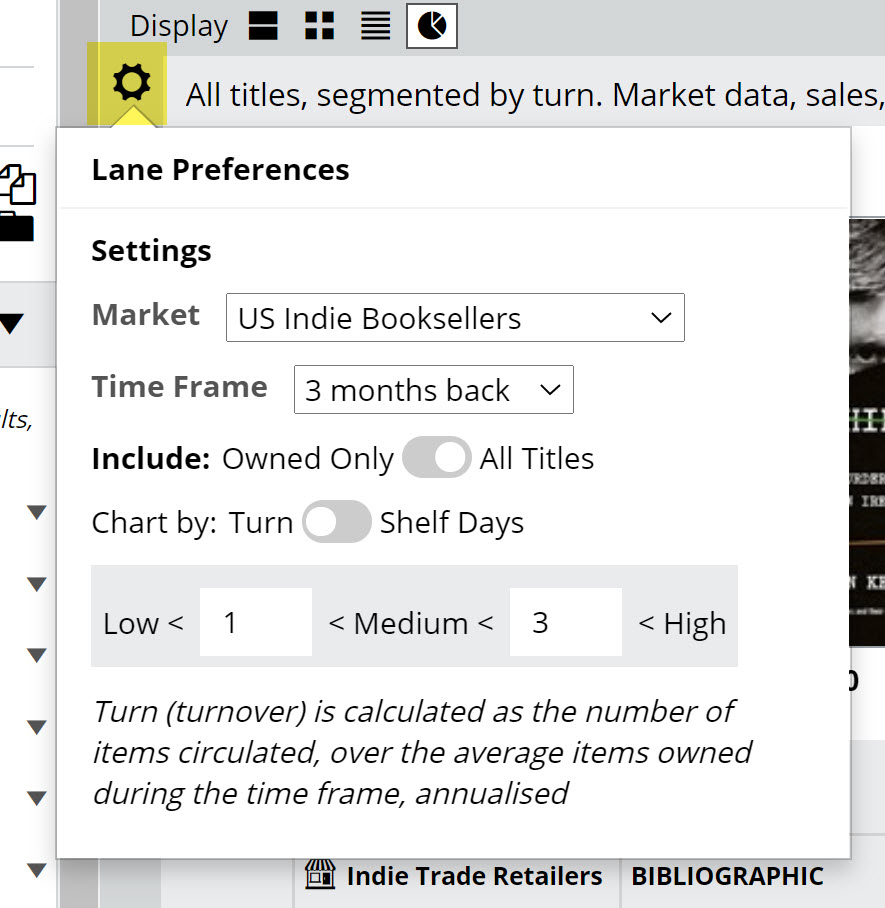
Change various parameters here:
See the Title Detail chart below the graph.
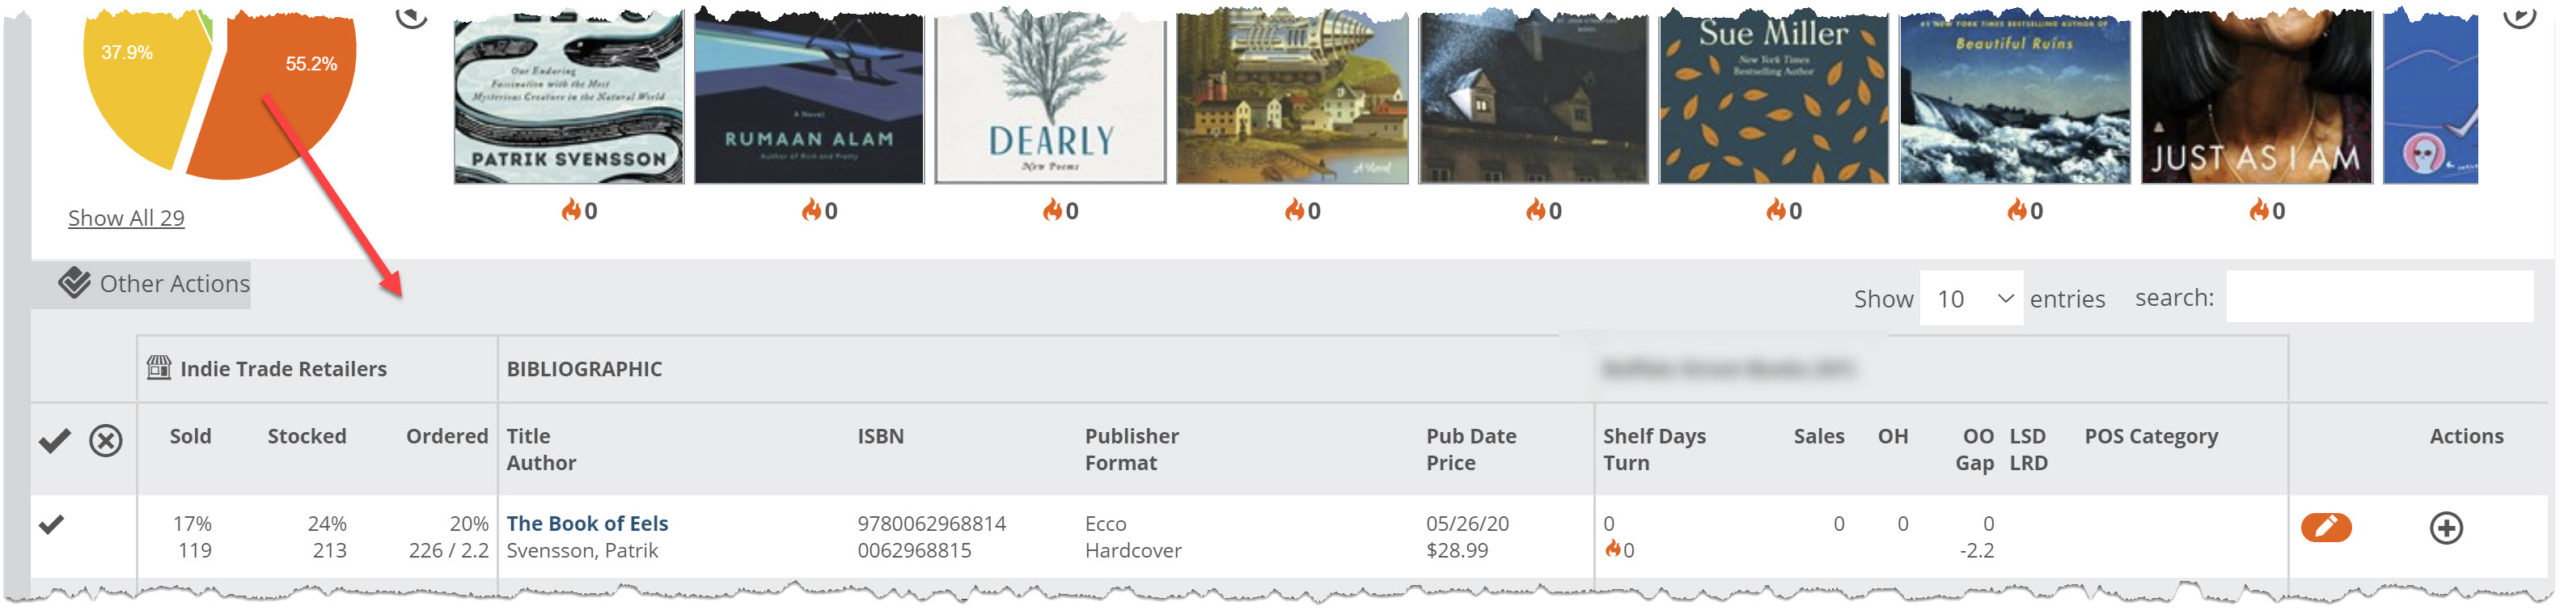
See more about reading the Title Detail chart here.
You’ll see market performance data on the far left, using the market and time frame that you’ve selected. Sales, Orders, Stock levels are there to help you reach a larger understanding of a title and its place in the market. The information on the right will show your selected account’s performance information.
See details about a title by clicking on the title itself, where you’ll also be able to see the Cross-store Data mentioned above.
Daily Analytics Emails
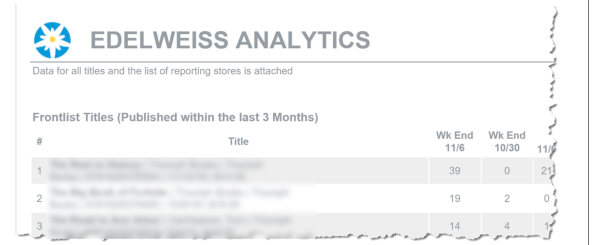
Finally, publishers who subscribe to Edelweiss Analytics receive Daily Sales at the Trade Indies emails, which show aggregated sales of your books at all of the indie stores that send us daily POS data (over 400!). These emails allow you to immediately see how your new hot titles are doing even before any bestseller lists come out. They show both weekly and daily sales, giving you the information you need to take action now.
You’ll see a quick rundown of your top 20 selling titles in three categories: titles published within the last 3 months, titles published 3-9 months ago, and older backlist. These are actual sales numbers – not just direct order numbers or estimates.
Administrators at Edelweiss Analytics subscribing publishers can let us know who should receive these emails.