You can very quickly get an easy Stock Analysis-type view of any title list in Edelweiss, whether it’s an order, filtered search, list of Buzz titles, Tags, a Collection, etc.
Getting there is as simple as clicking this Analytics Display icon at the top of any title list:
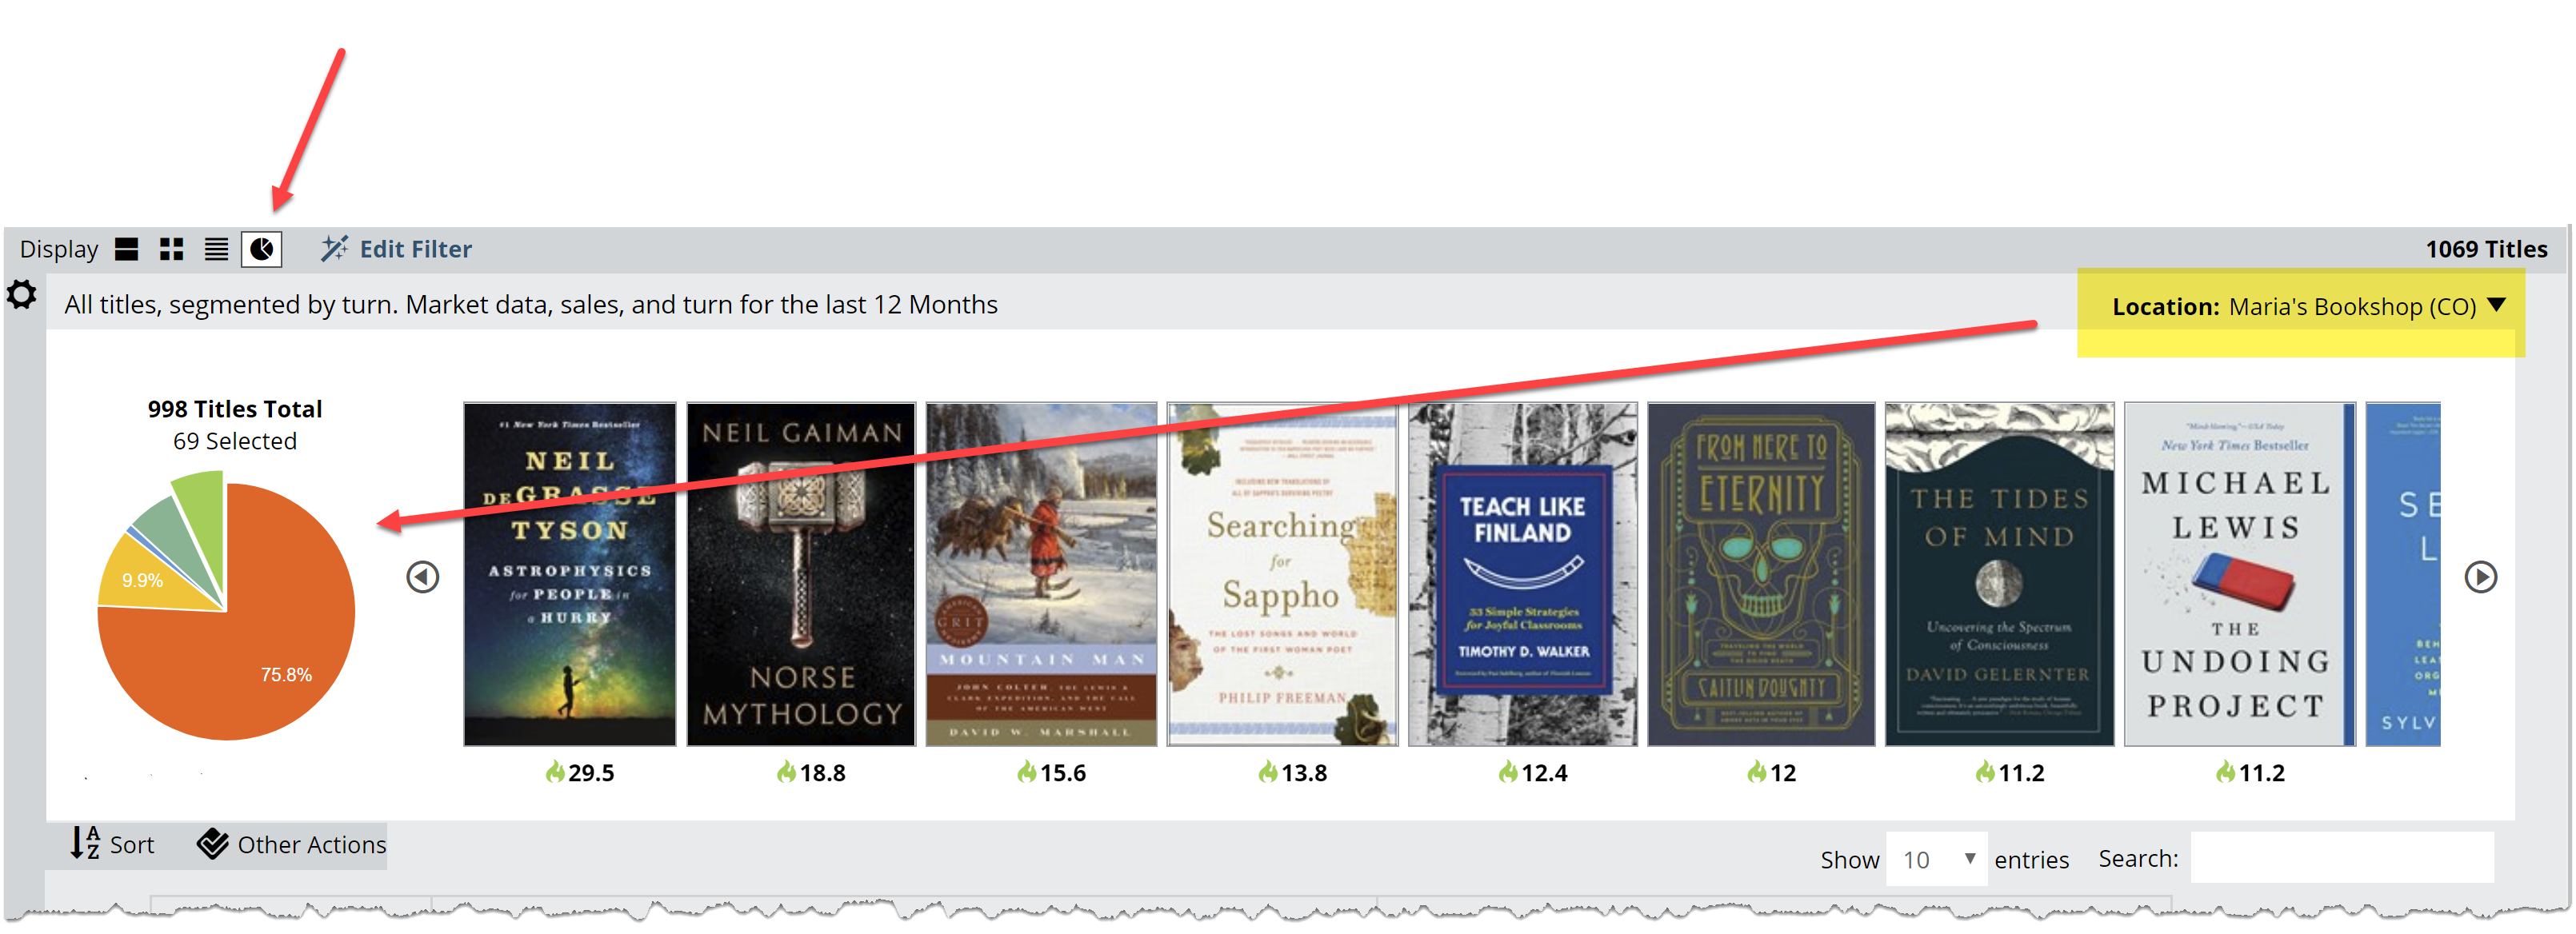 Choose a location/store to analyze at the top right.
The full pie graph will represent all the titles in the current list of titles. That list will be broken down according to either the usual Shelf Days parameters, or according to Turns, as well as the store’s current stock and performance status. This means that for any given list of titles, you can see how they’re performing for a particular account, or whether they even have them in stock or on order.
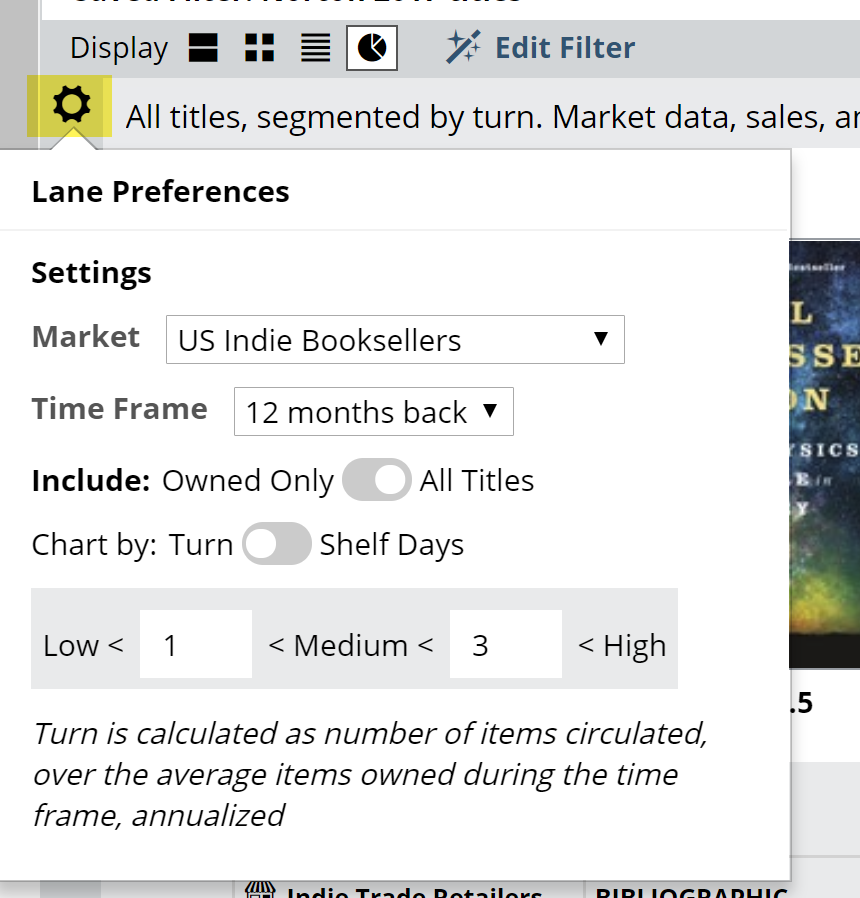
Change various parameters here:
See the Title Detail chart below the graph.
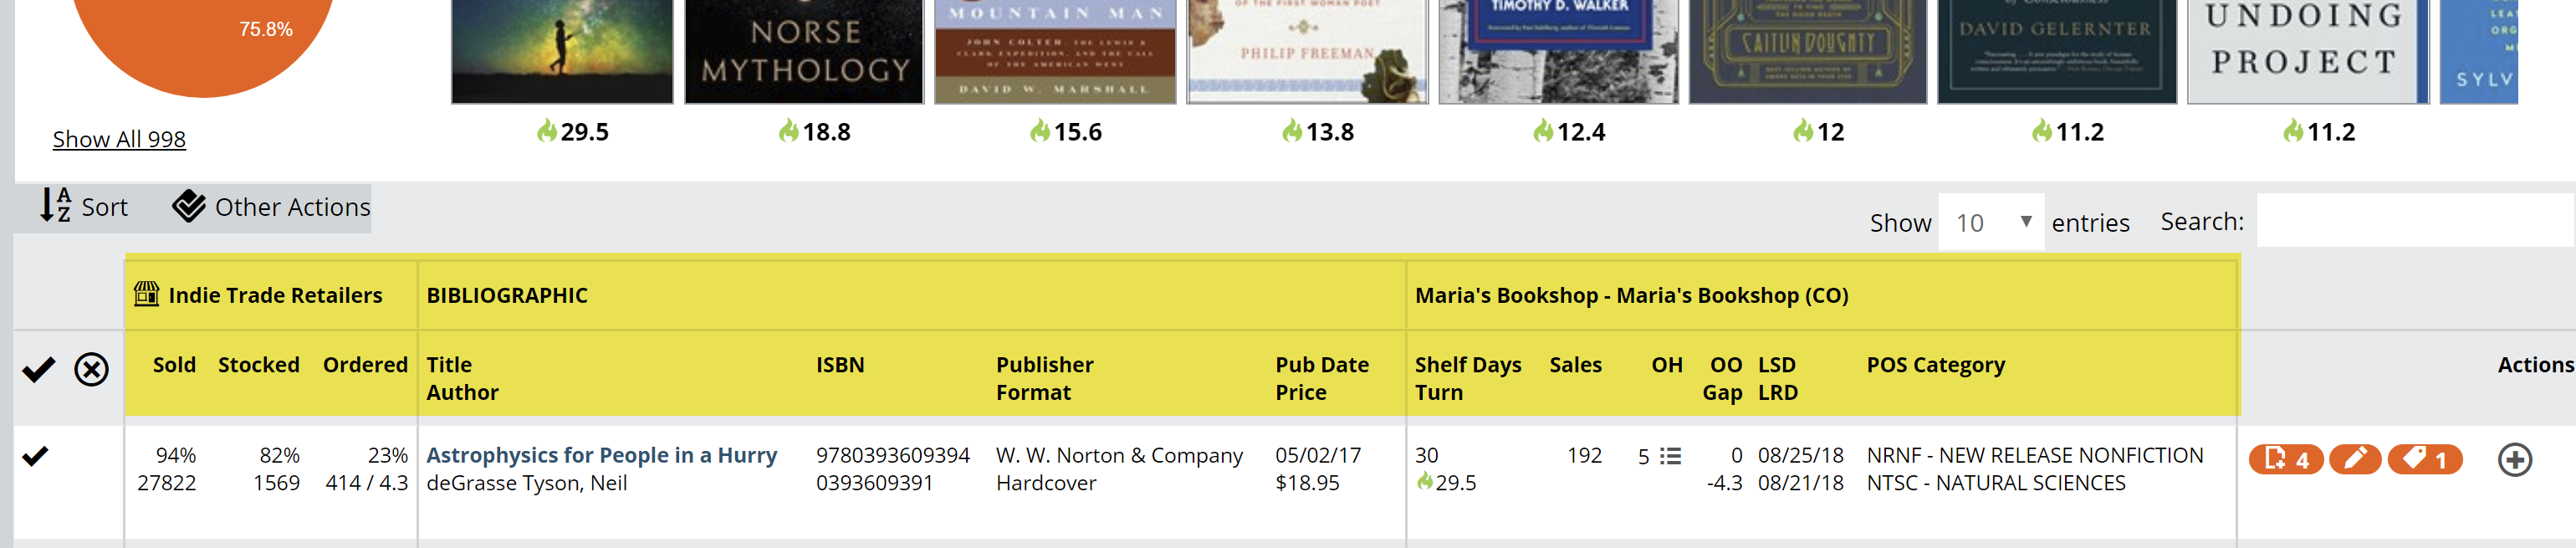
See more about reading the Title Detail chart here.
You’ll see market performance data on the far left, using the market and time frame that you’ve selected. Sales, Orders, Stock levels are there to help you reach a larger understanding of a title and its place in the market. The information on the right will show your selected account’s performance information.
See details about a title by clicking on the title itself.

Sort the list as you like:

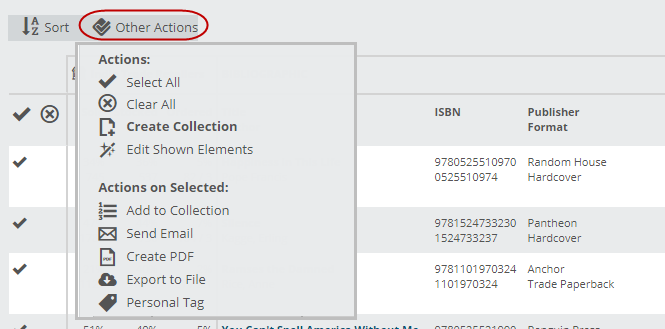
You can perform a number of the usual Edelweiss actions, including adding titles (or groups of titles) to Collections, adding Tags, emailing, Creating PDF’s, etc.