Click the gear icon to reveal a menu in which you can set a few parameters for this graph.
Here’s an explanation for each of your options:
Catalog:

Start typing to look for specific catalogs. Publishers are often somewhat inconsistent with how they name their catalogs, so more of a ‘keyword’ sort of search is usually more fruitful (Like “Fall 2017… and then a quick scroll through the resulting list). You can narrow the search down quite a bit by telling the tool to search for catalogs posted in the last ___ months when relevant. You can also find your Collections here. Collections are italicized. Clear out a catalog selection by clicking the – icon indicated by the dotted arrow in the image above.
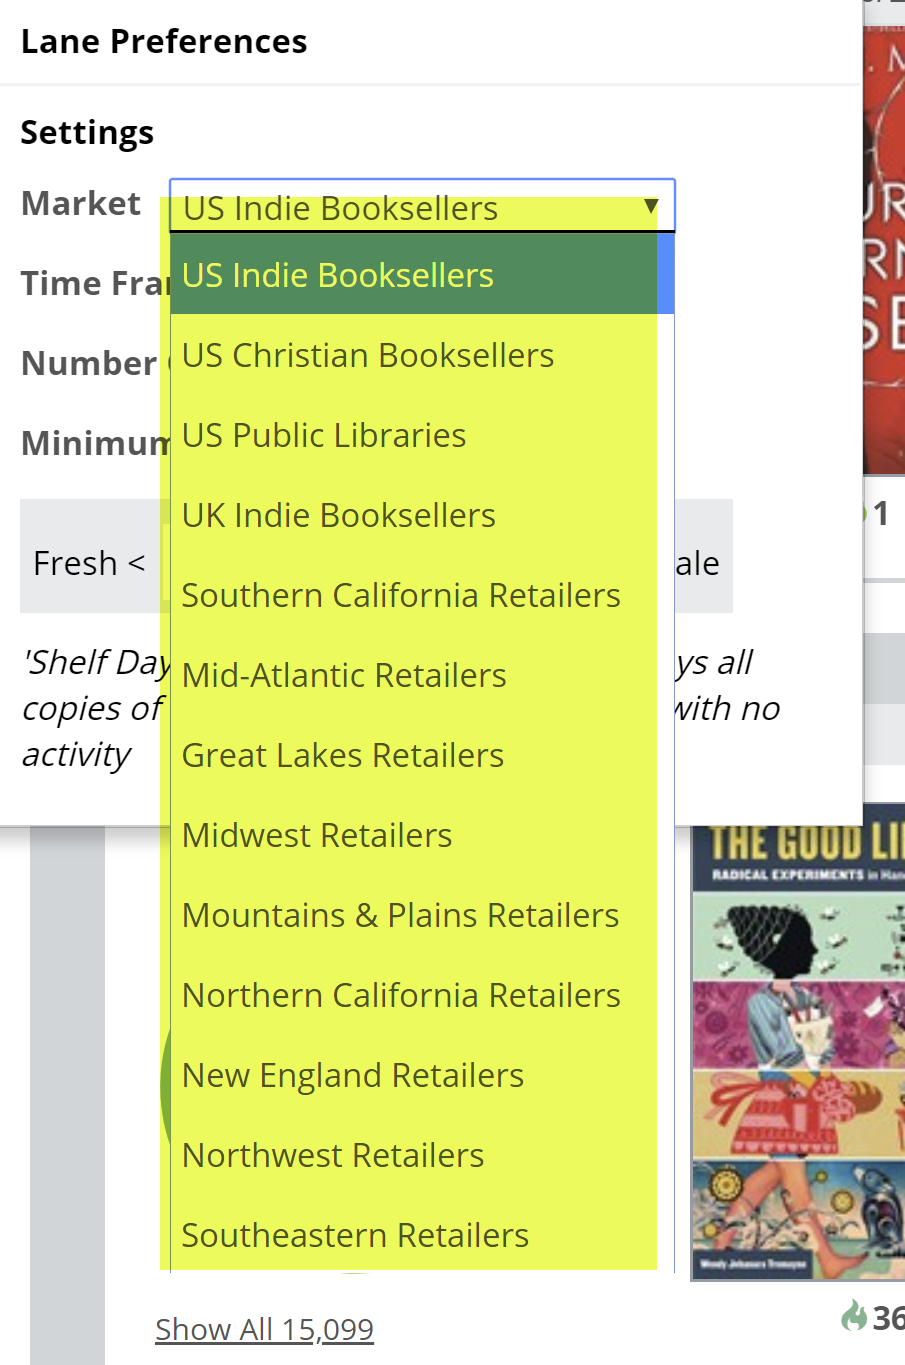
Market:

You can select to view market results for a variety of regions, etc. In this particular tool, the graph itself will not be affected by this Preference setting. The Title Detail List’s Market data will reflect this selection.
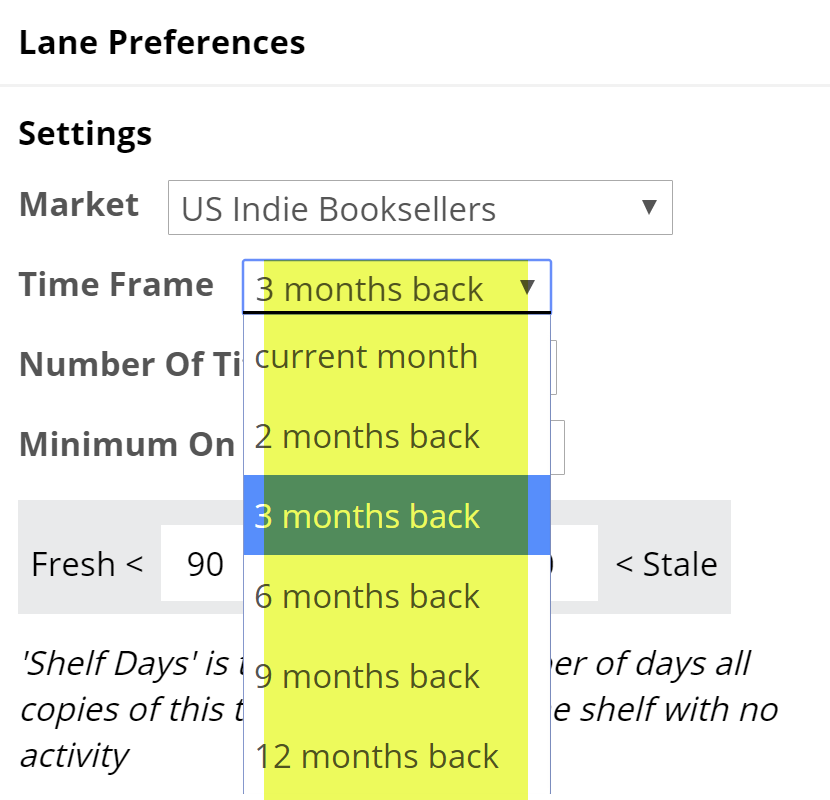
Timeframe:

How far back would you like to look? Viewing results for 1 month back will essentially show which of the titles in the specified list are hot and selling right now… or not selling. Looking farther back, like a year, will show a longer tail of sales, so to speak. Keep in mind that looking farther back will include other seasons, like the holidays, summer, etc. Generally, speaking setting this a ways back makes a lot of sense.
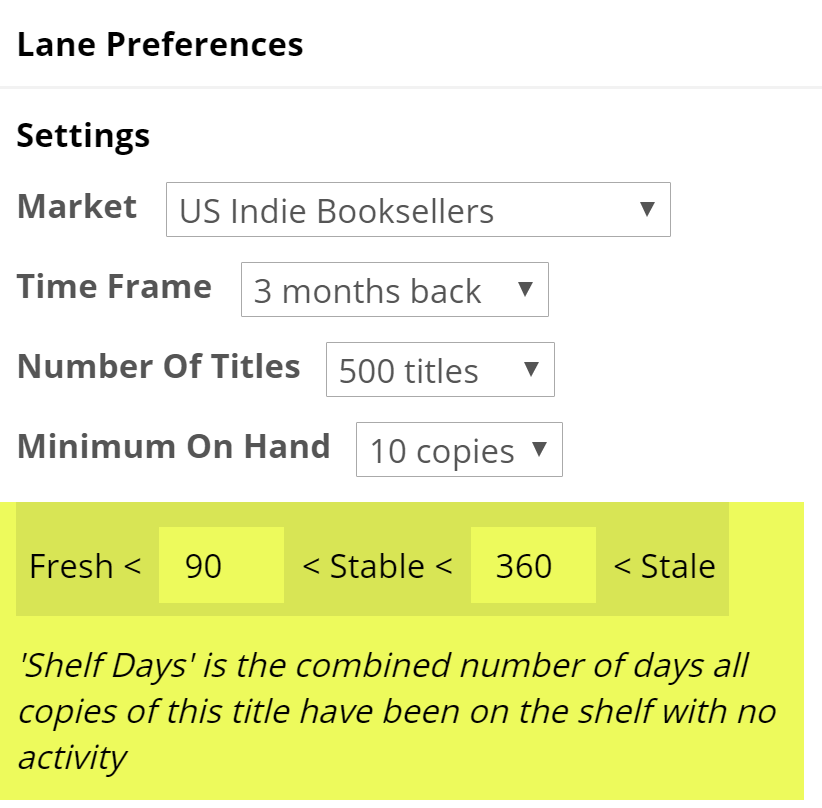
Shelf Days:

The Shelf Days measure is fully explained here. This essentially allows you to set an upper and lower performance measure. So, how well, and how quickly, are your titles selling? These thresholds are especially relevant in this lane.


