
There are quite a lot of things you can do using the Edelweiss Analytics tools. We’re aware that the options and the amount of information can be a bit overwhelming at first, so below, you’ll find a few Getting-Started ideas to help acquaint yourself with some of the more immediately gratifying tools.
The whole push here is for you to see how your titles are doing at your indie retail accounts. Using the tools introduced below, you’ll be able to see the performance of specific titles, as well as the performance of all of your titles at a specific account, etc. There are, of course, also tools to help you react to what you see in meaningful ways.
See a “Cross-Store” view of a title’s performance
Find a title using the Edelweiss search functions, or from within a catalog. Click the “expand” icon next to the title.
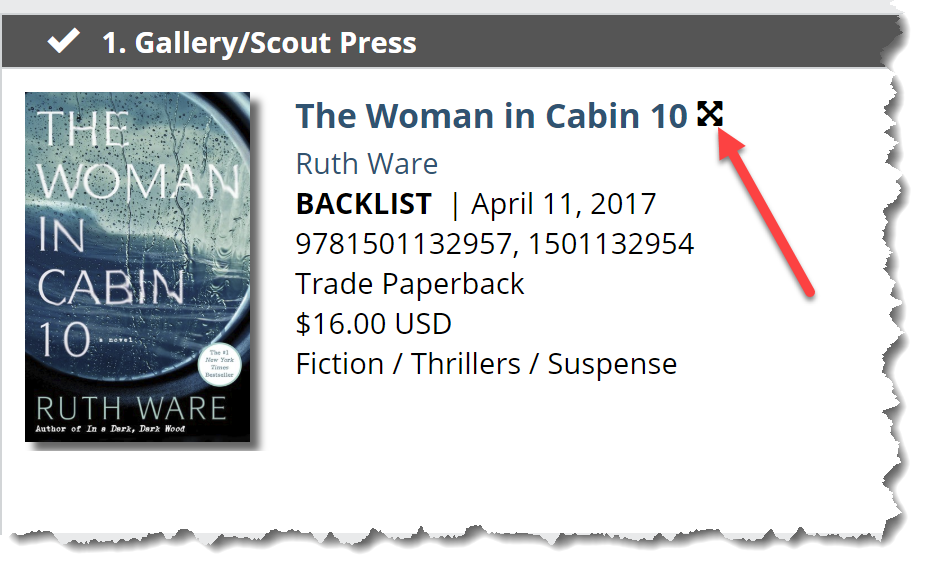
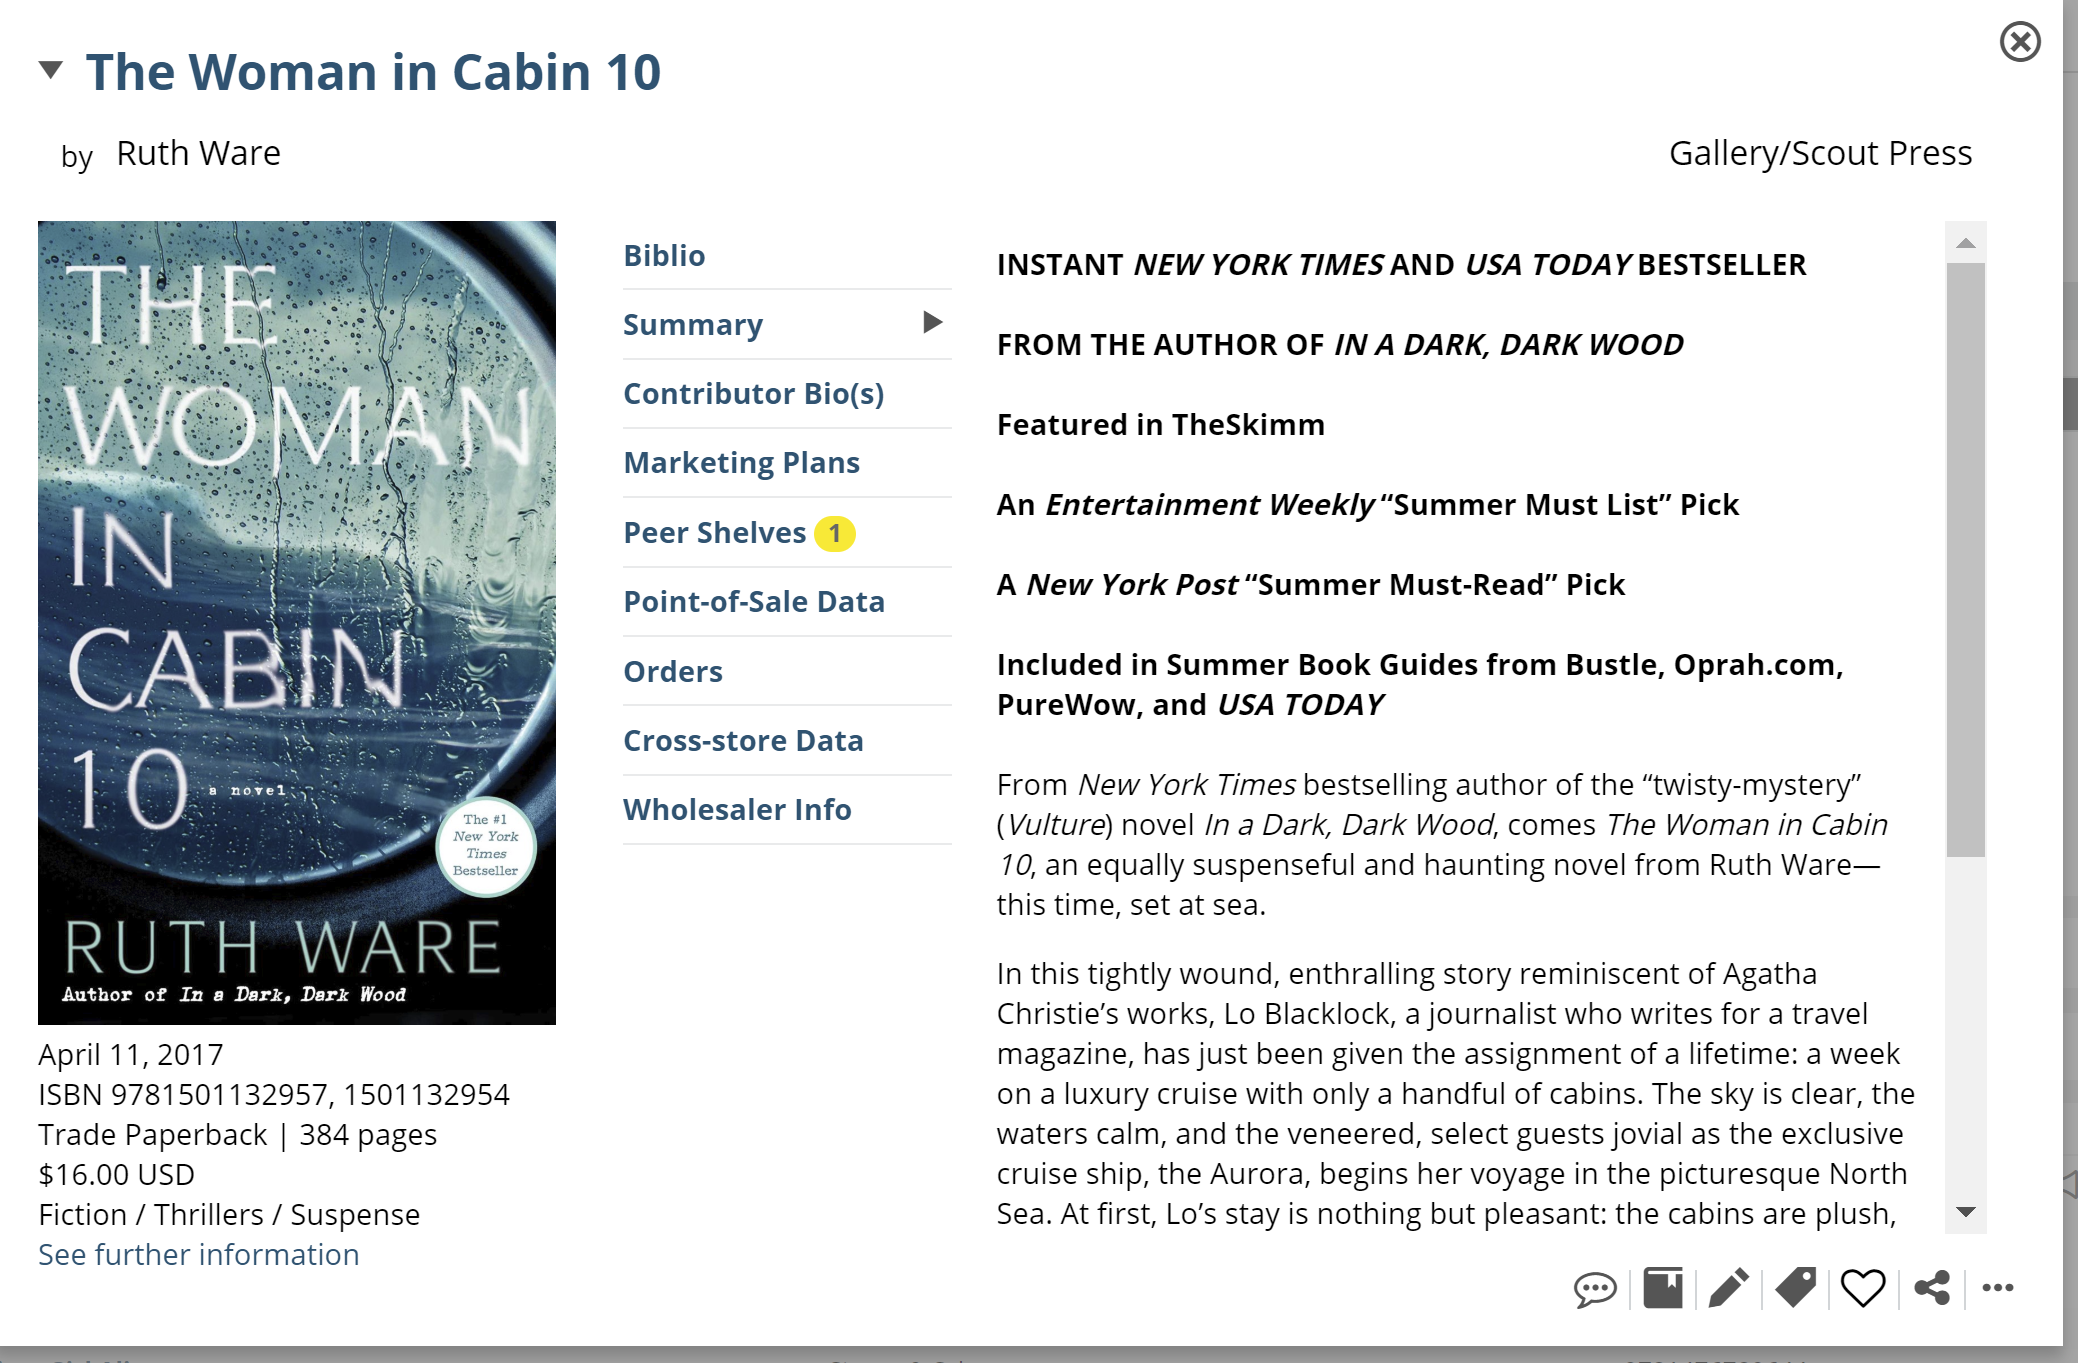
in the screen that pops up, you’ll see lots of different elements:
 The Cross-store Data element will show actual sales at actual stores. Here’s a shot for a completely different, anonymous title:
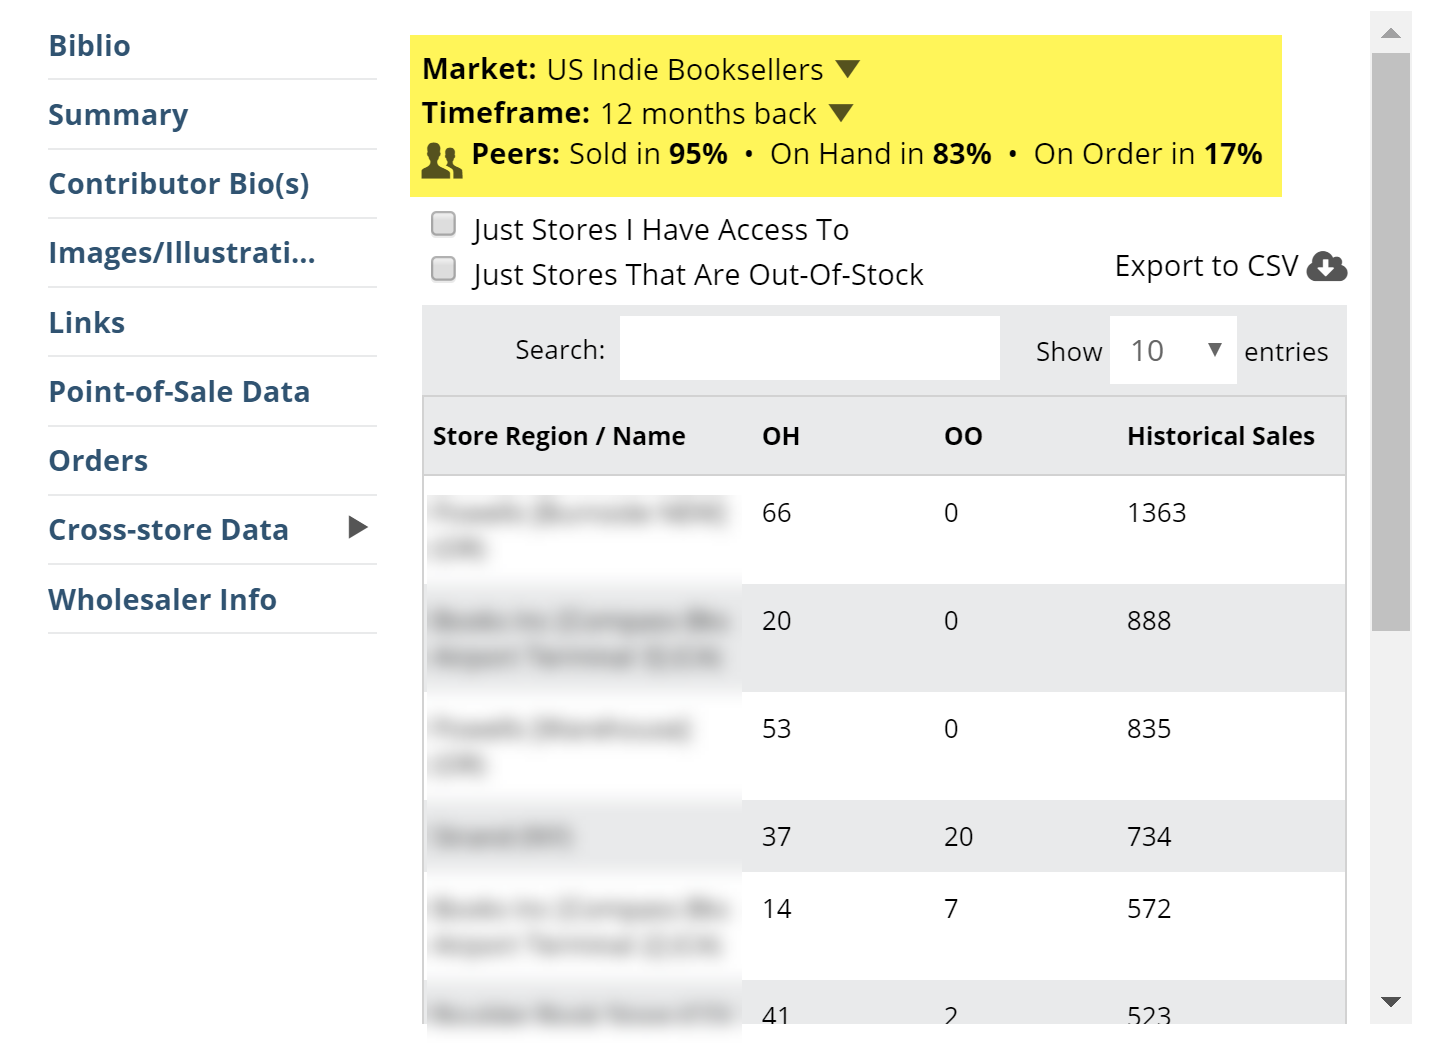 In your own view, you’ll see store names and locations. Note that at the top of the tool you can change Market and Time Frame.
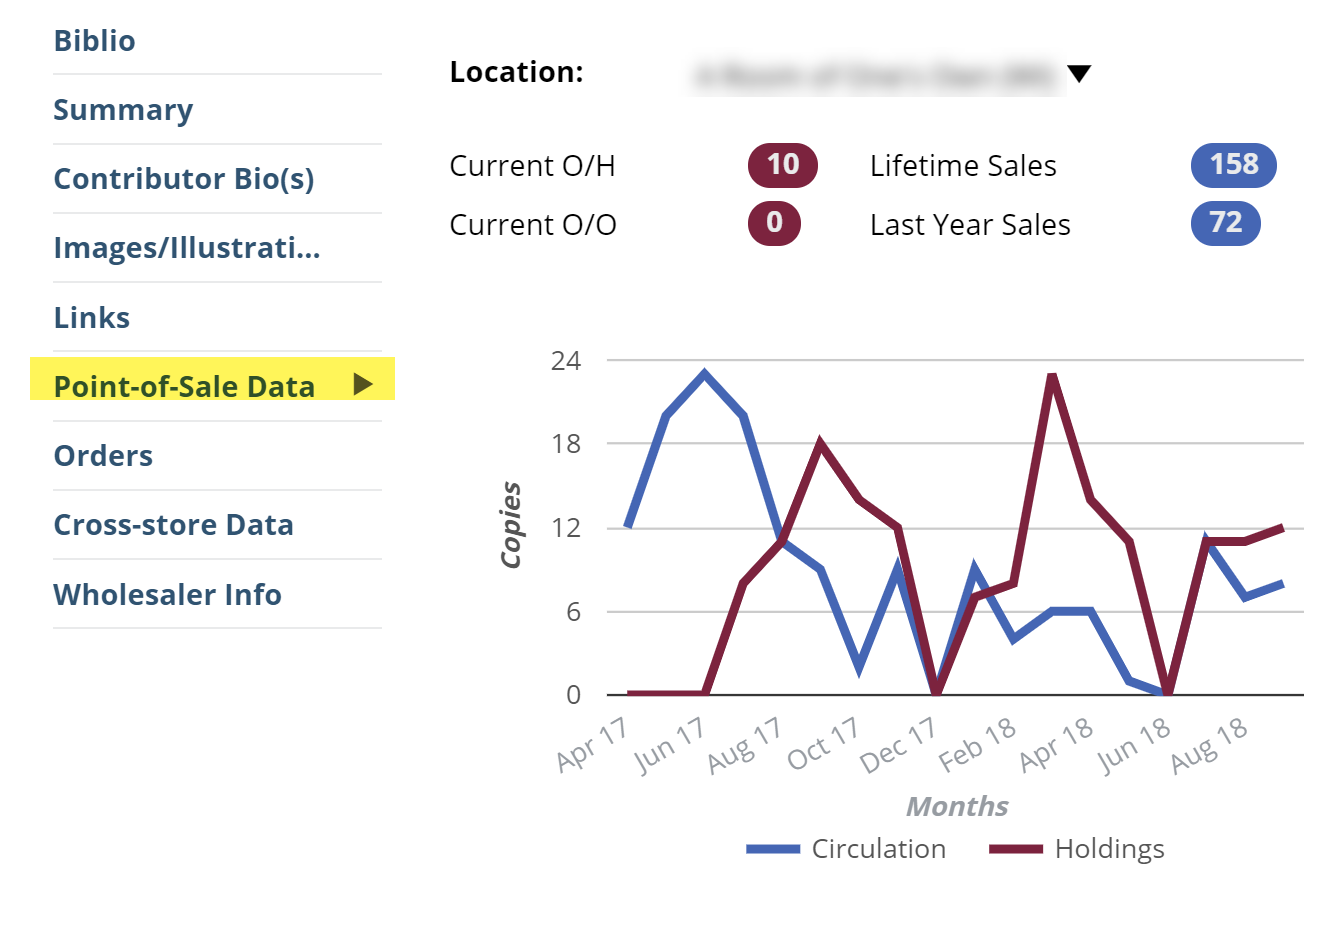
In that screen, you can also dig in to a specific store’s history with that title under Point-of-Sale Data.
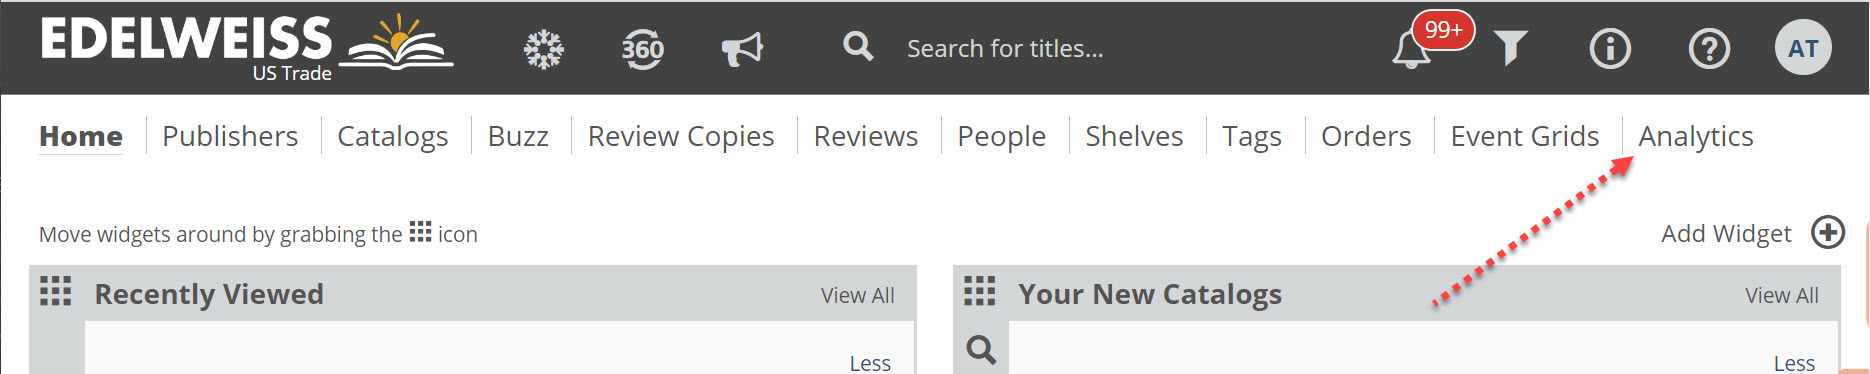
 Analytics View
You can very quickly get an easy Stock Analysis-type view of any title list in Edelweiss, whether it’s an order, filtered search, list of Buzz titles, Tags, a Collection, etc.
Getting there is as simple as clicking this Analytics Display icon at the top of any title list:
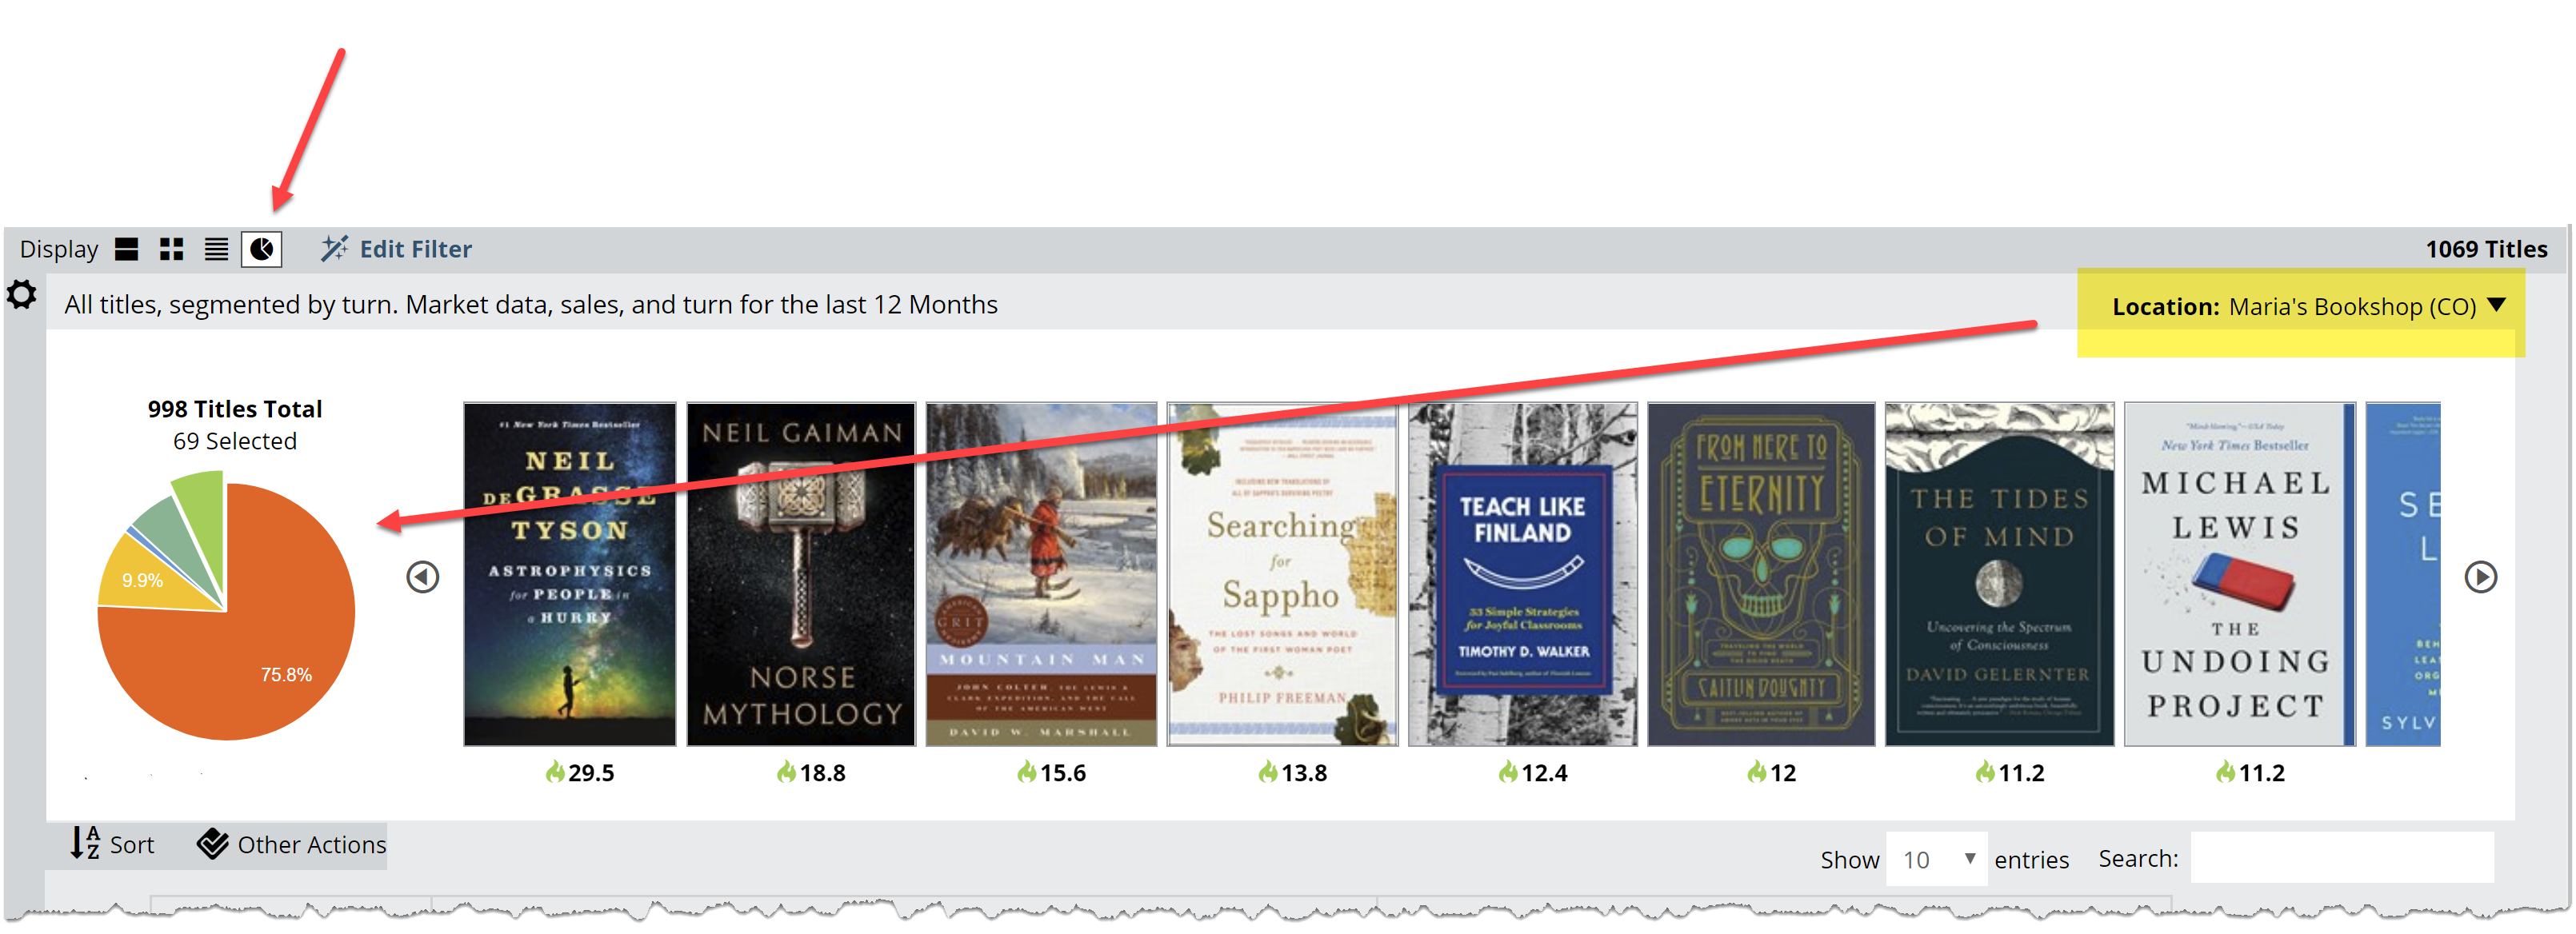
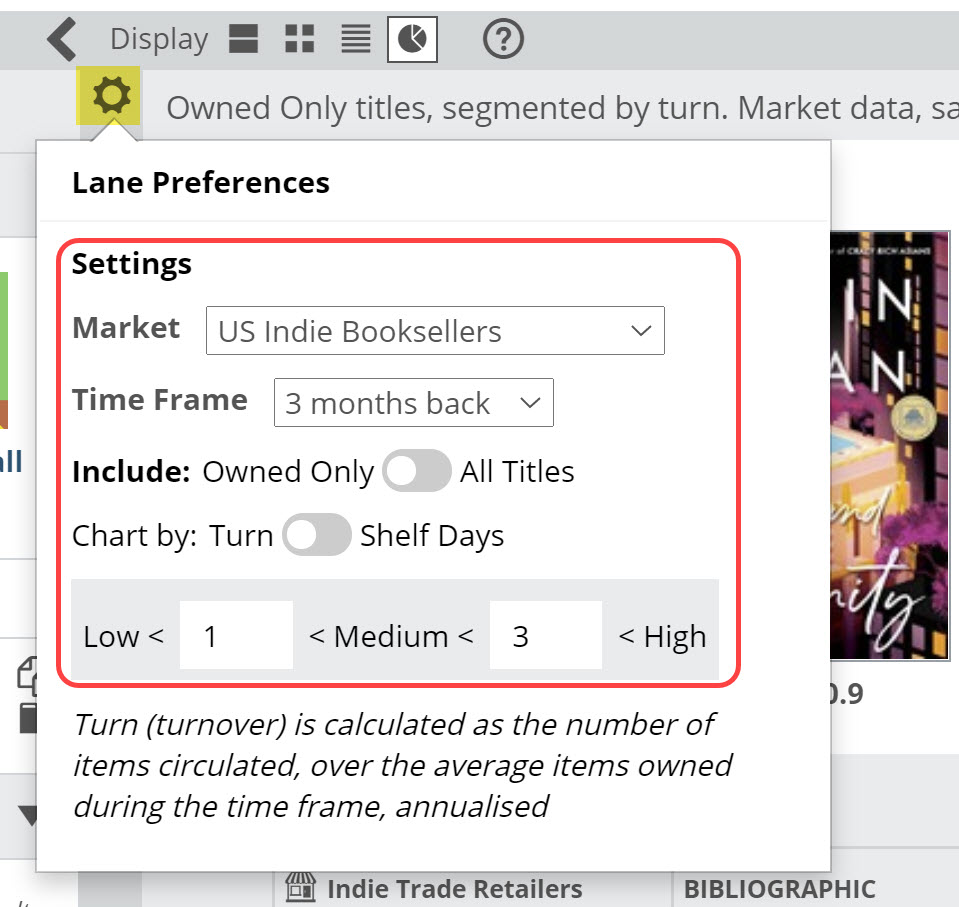
Change various parameters here:
Analytics Page
Note that each tool has its own set of instructions and considerations written up in the Publisher Analytics Knowledge Base. There is also a section for Essential Knowledge, which covers basic navigation, as well as common concepts important to understand when using the analytics tools. This is also where recordings of webinars are held, if you prefer to learn by watching a video.
You can find instructions for each tool linked below, as well… since you’re already here:
Most Popular Titles: An tool that shows your most popular titles in a given time frame, and depending on any filters you have set. You can see an account’s performance and stock status for those most popular titles
Not Yet Released: A tool that shows your most ordered upcoming titles, as well as an account’s order status.
Stock Analysis: An analysis of how an account is performing specifically with your titles.
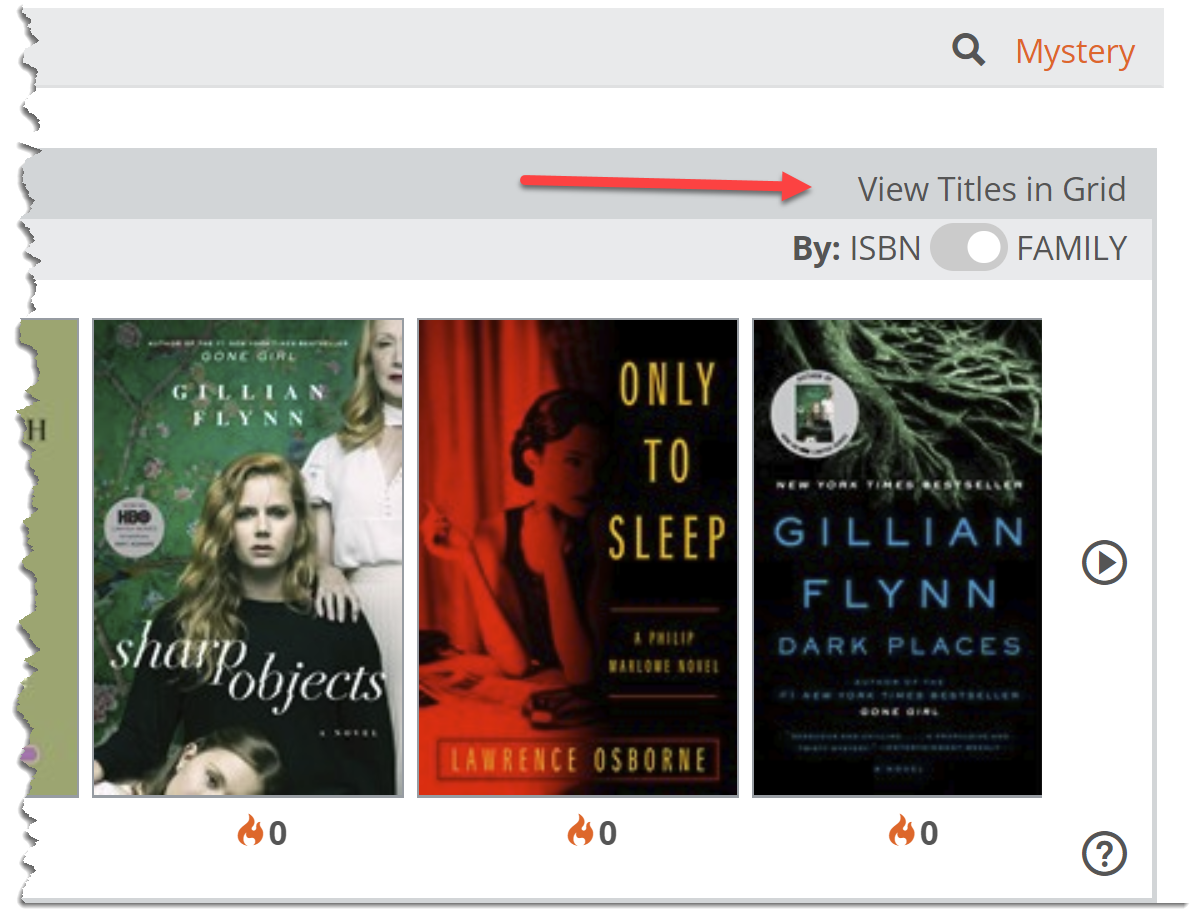
See more detail about the titles shown in each list by viewing the Title Detail List.
This will expand the section of the pie you’ve selected into a more detailed list, showing market performance details, and additional information about each titles’ performance at your selected account.
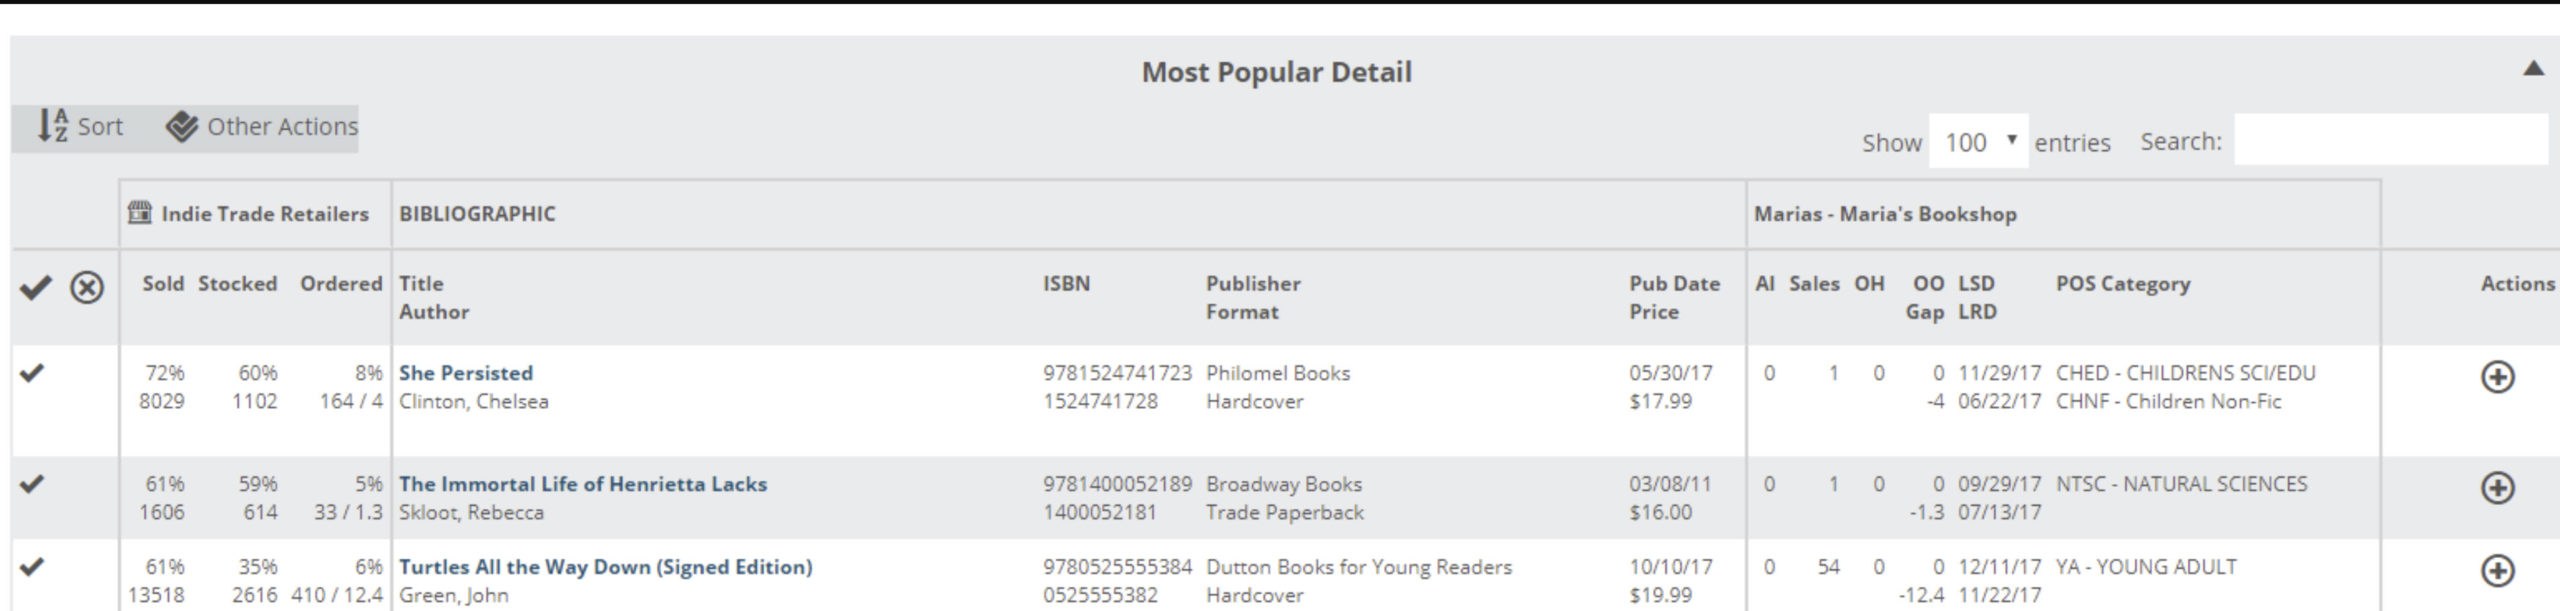
This title grid shows a wealth of information, all sortable and searchable.
Title performance is measured based on a Shelf Days measurement, which essentially provides a metric that takes in to account the number of copies and the number of days since that title last had some activity (either received or sold).
